Answer to Question 1
D
Answer to Question 2
Recall that real GDP is found by valuing GDP in a particular year using base year prices. When 2011 is the base year, real GDP for 2016 is found by multiplying 2011 prices by 2016 quantities and then adding the values up. The individual values for 2016 (2011 is the base year) are calculated in the following table:
Product Quantity Price Value
Pizzas 120 10 1,200
Haircuts 45 15 675
Backpacks 210 40 8,400
Therefore, Real GDP for 2016 (2011 base year) =
Quantity of pizza in 2016 price of pizza in 2011 = 1,200
Quantity of haircuts in 2016 price of haircuts in 2011 = 675
Quantity of backpacks in 2016 price of backpacks in 2011 = 8,400
Total 10,275.
The individual values for 2016 (2016 base year) are calculated in the following table:
Product Quantity Price Value
Pizzas 120 12 1,440
Haircuts 45 20 900
Backpacks 210 45 9,450
Therefore, Real GDP for 2016 (2016 base year) =
Quantity of pizza in 2016 price of pizza in 2016 = 1,440
Quantity of haircuts in 2016 price of haircuts in 2016 = 900
Quantity of backpacks in 2016 price of backpacks in 2016 = 9,450
Total 11,790.
When 2016 is used as the base year, the calculation of real GDP is larger as compared to the calculation of real GDP for 2016 assuming 2011 is the base year. The values differ because the prices are different in 2011 and 2016, so the value of real GDP does depend on the chosen base year. However, since we use the same base year prices for every year when we calculate a GDP series, we can still compare real GDP across the different years.

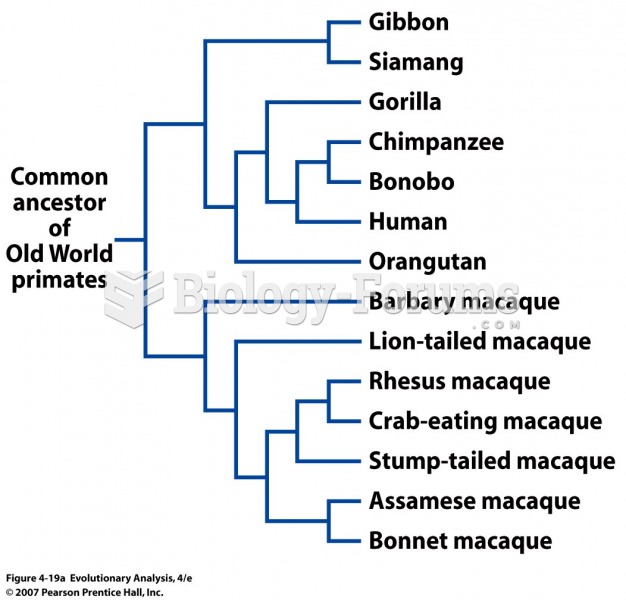 Phylogenies showing the relationships of some Old World primates
 Expected and Unexpected Reinforcers
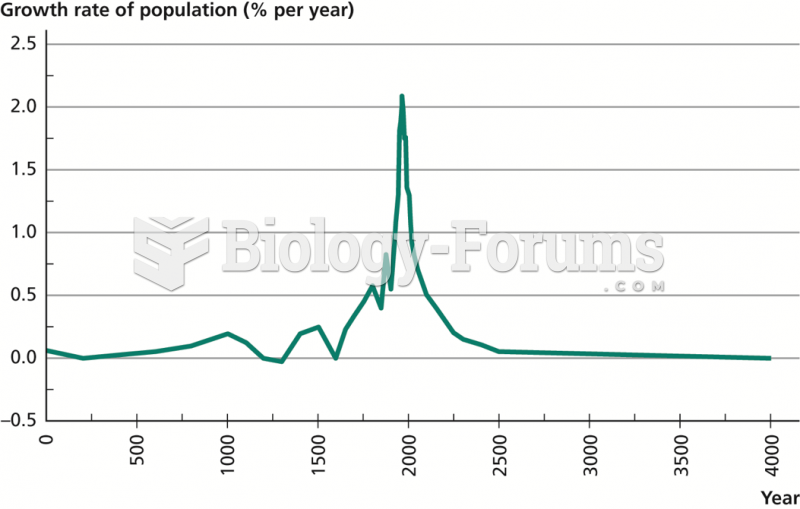 The Great Spike in World Population Growth
 The expected value for a binomial probability distribution is _____.
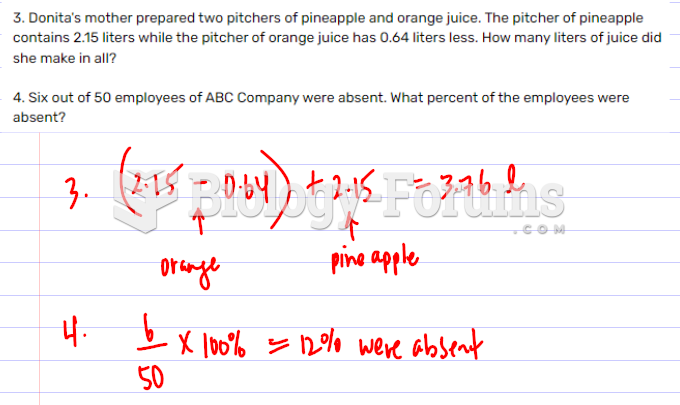 Business Math
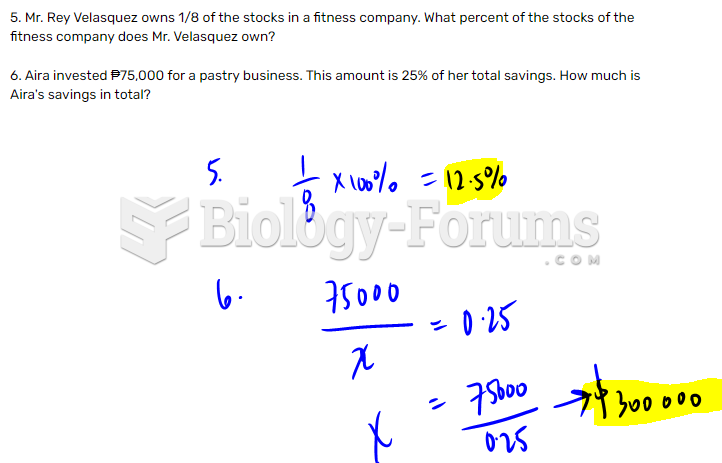 Business Math