This topic contains a solution. Click here to go to the answer
|
|
|

 The Tilt of Earth’s Axis
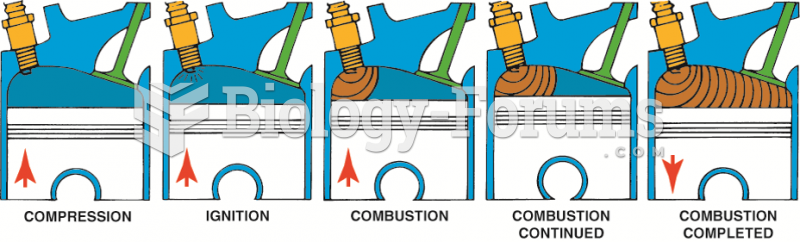 Normal combustion is a smooth, controlled burning of the air–fuel mixture.
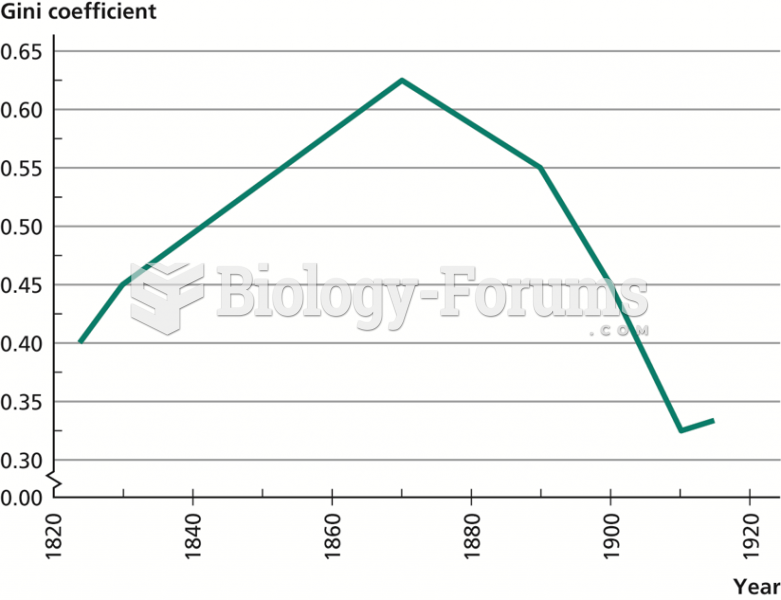 The Kuznets Curve in England and Wales, 1823–1915
 Normal (emmetropic) eye
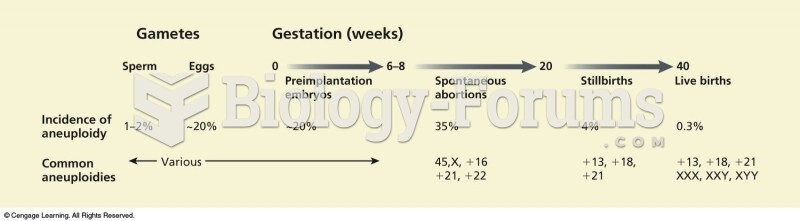 The frequency of aneuploidy changes dramatically over developmental time. Between 6 to 8 weeks and 2
 Construct a Lorenz curve that shows income distribution in this society.