This topic contains a solution. Click here to go to the answer
|
|
|

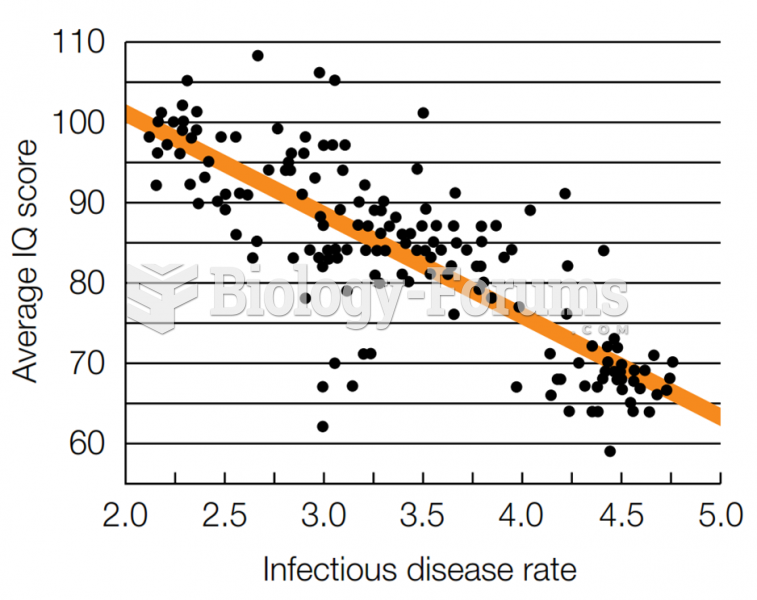 Inverse Relation Between IQ and Disease. Could this explain the Flynn effect?
 How to create a price index to calculate inflation for a basket of goods
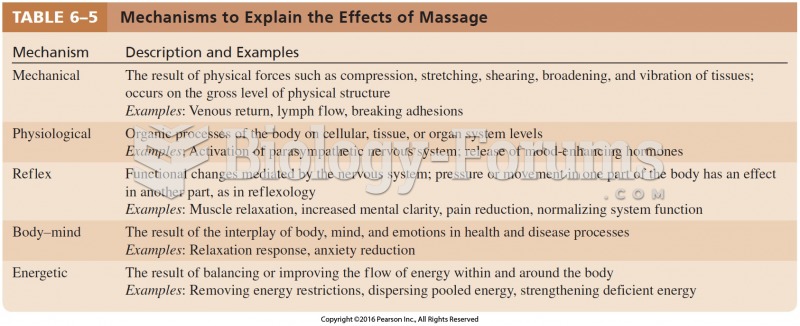 Mechanisms to Explain the Effects of Massage
 Calculate the pH of a solution formed by mixing 120.0 mL of 0.30 M HClO with 1180.0 mL of 0.20 ...
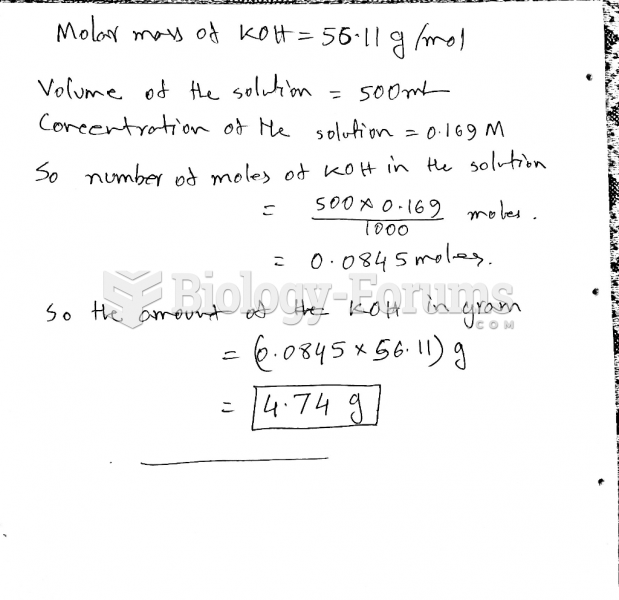 Calculate the number of grams of solute in 500.0 mL of 0.169 M KOH.
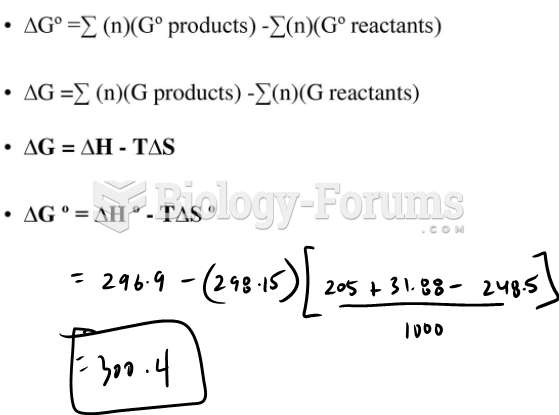 Calculate ∆G°