This topic contains a solution. Click here to go to the answer
|
|
|

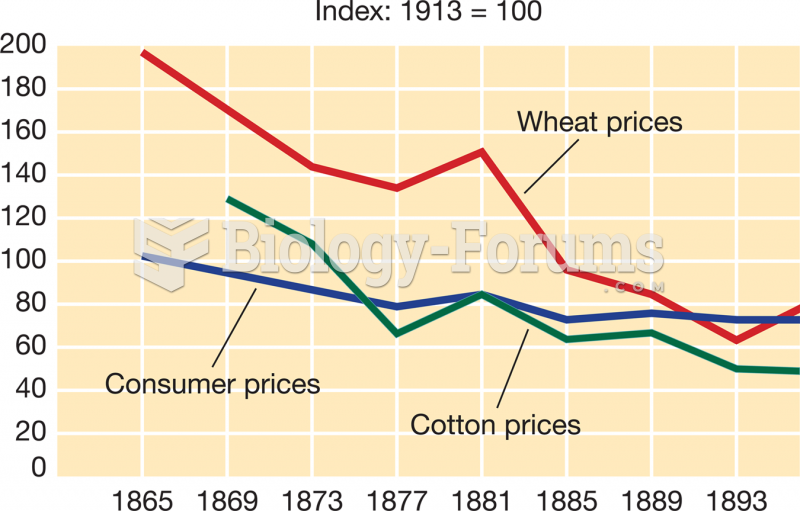 Wheat and Cotton Prices and Consumer Price Indexes, 1865–1896
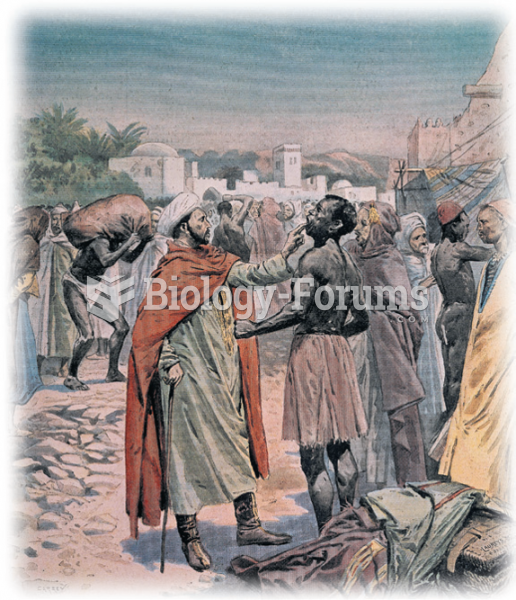 A slave market in Marrakesh, Morocco. This lithograph is from the 1800s.
 The high-voltage disconnect switch is in the trunk area on a Toyota Prius. High-voltage lineman’s ...
 The popliteal area. Avoid heavy pressure over the back of the knee joint.
 Mobilize knuckles with figure-8s. Turn the hand so palm faces the table. Grasp the proximal phalange ...
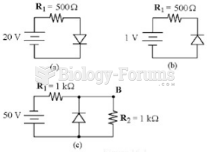 What is the current in Figure 16-1(b) if the diode is made of silicon and the polarity of the ...