|
|
|

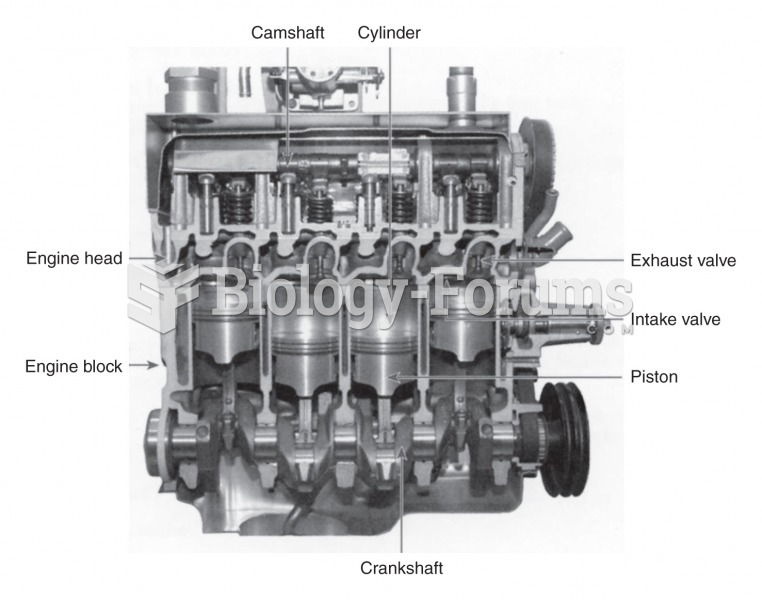 Cutaway diagram of a four cylinder gasoline engine
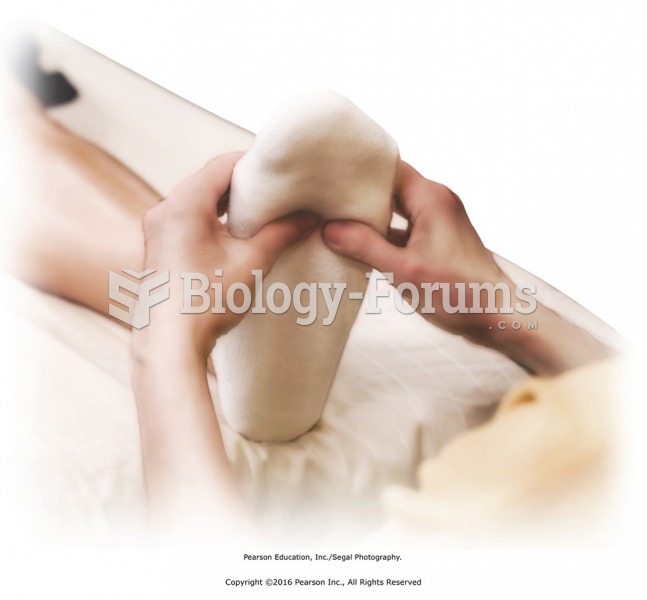 Apply scissoring between metatarsals and figure-8s on toe joints to mobilize the foot.
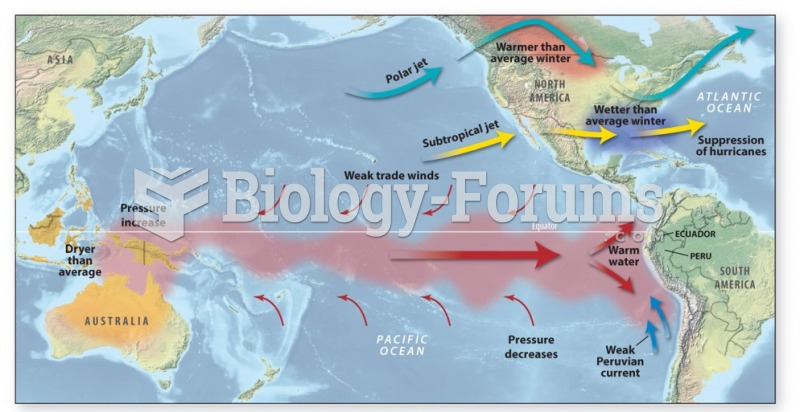 El Niño/La Niña reverses flow
 economic question
 economic question
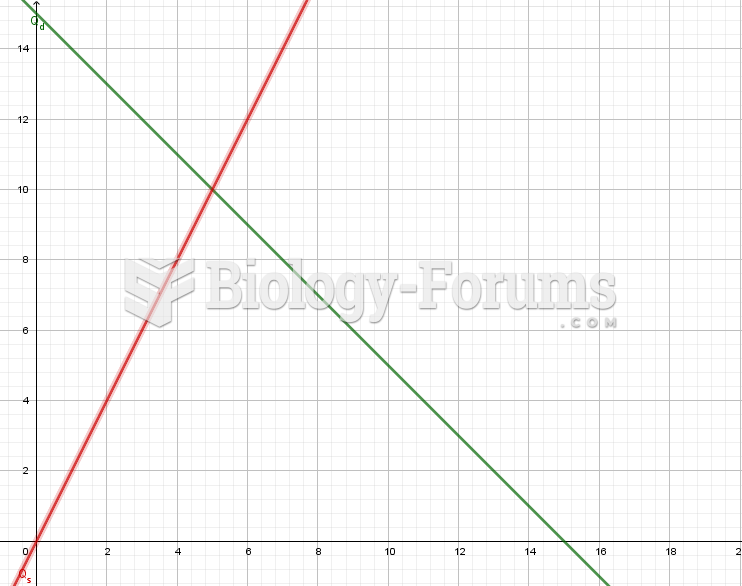 Economic practice question