This topic contains a solution. Click here to go to the answer
|
|
|

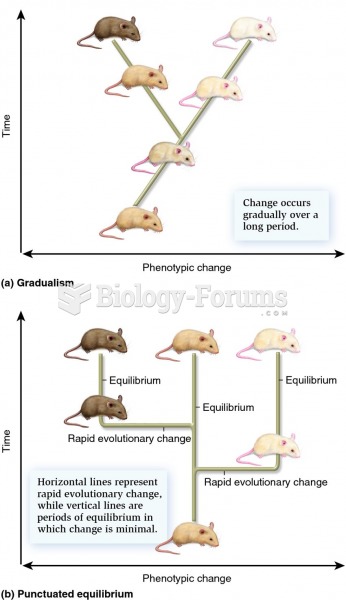 A comparison of gradualism and punctuated equilibrium.
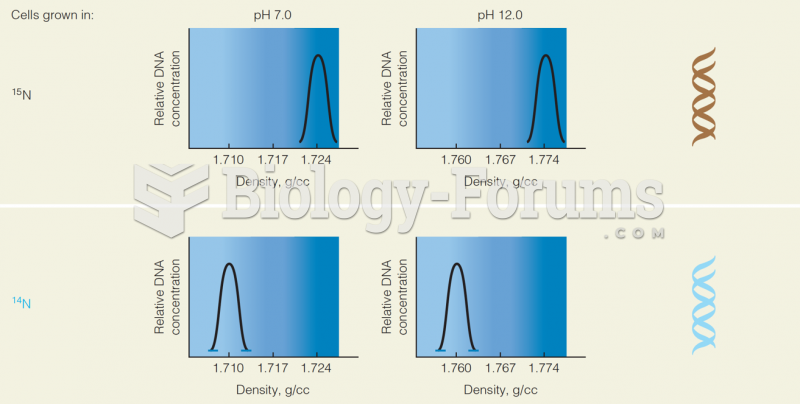 Cell Grown in 15N and 14 N: Graph of Relative DNA Concentration Vs. the Density
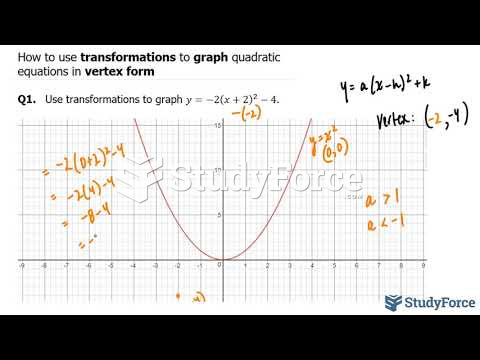 How to use transformations to graph quadratic equations in vertex form
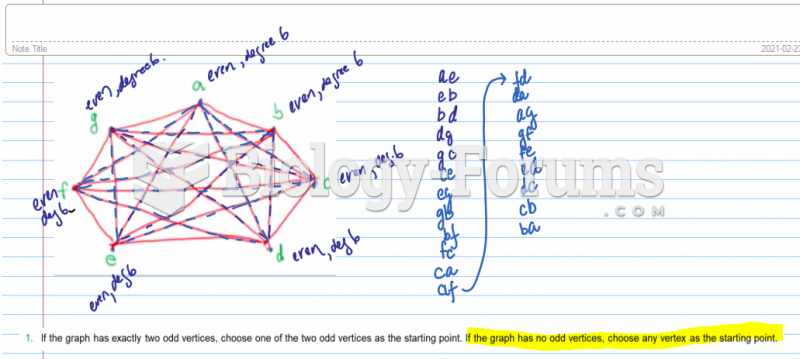 Use Fleury’s algorithm to determine Euler Circuit in the following graph. Exhibit exactly one ...
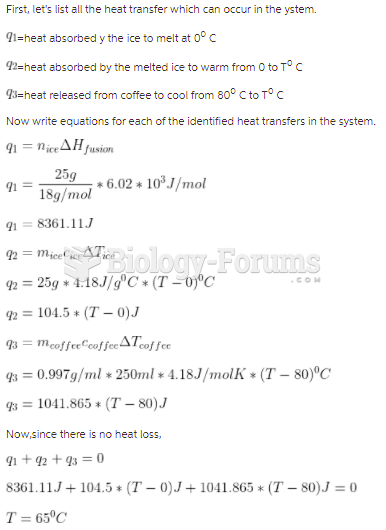 What would be the appropriate equilibrium temperature of a system obtained by adding 25.0 g of ...
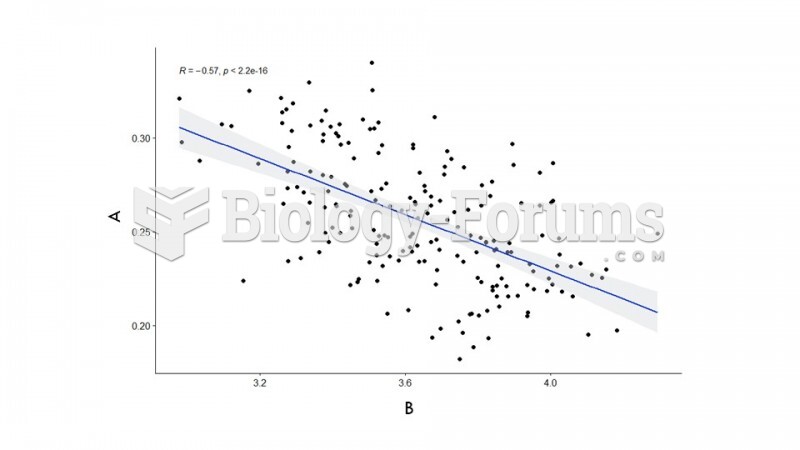 graph
graph