This topic contains a solution. Click here to go to the answer
|
|
|

 Periodic Table Tattoo
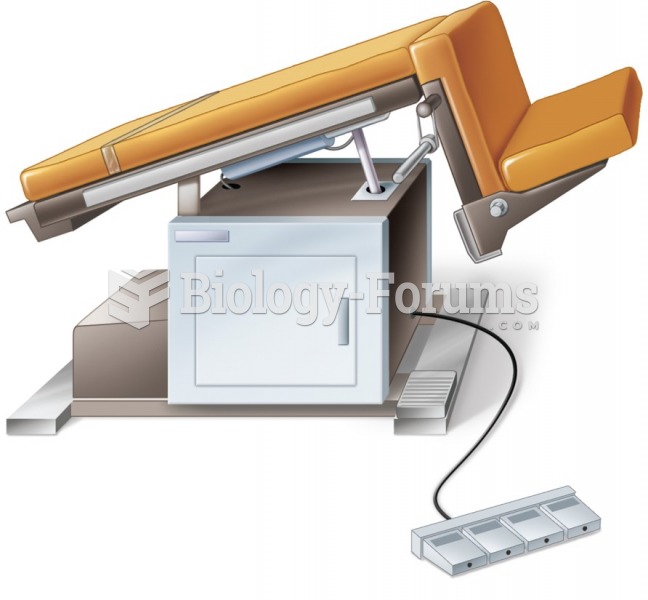 Proctoscopic examination table.
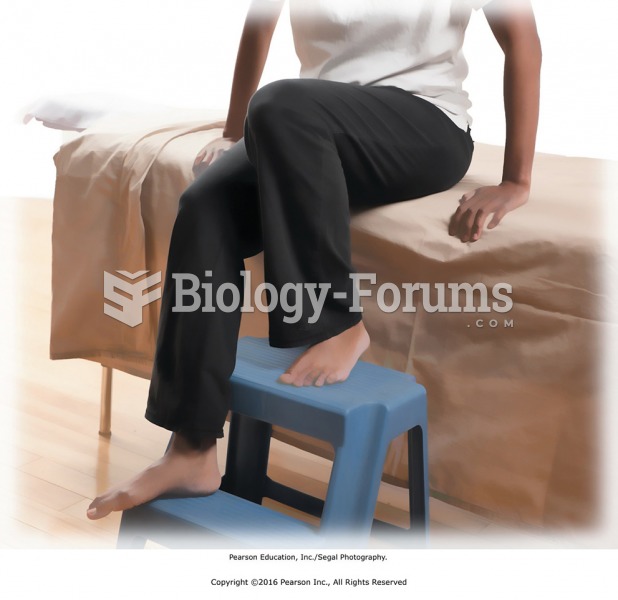 Step stool can help clients get onto and off of a high table.
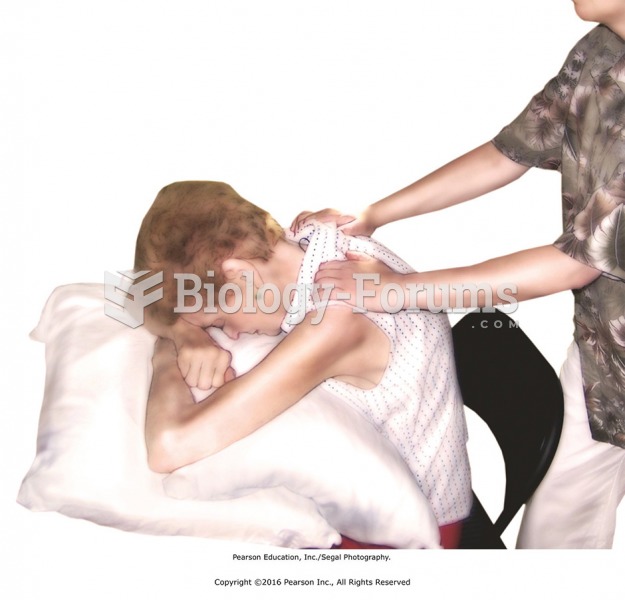 Leaning against a table with a pillow for support.
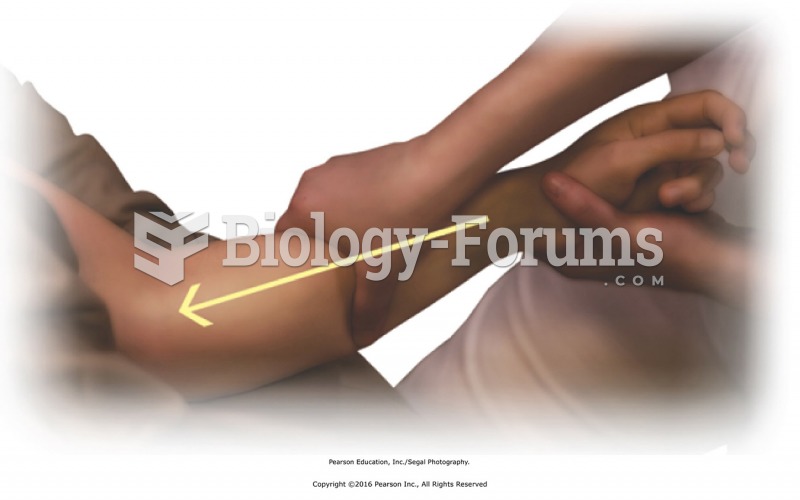 Apply draining stroke to forearm. Hold forearm off of the table with one hand. With the other hand, ...
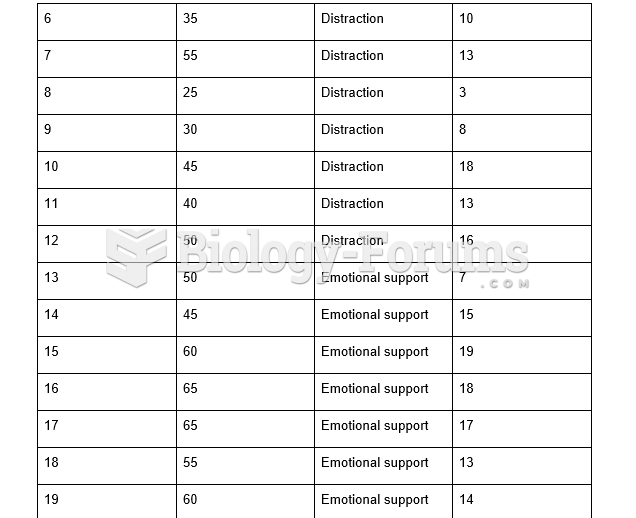 Table - Correlation Analysis