The figure above shows two Lorenz curves, one before income redistribution and one after income redistribution. The difference between the two curves equals
A) market income.
B) money income.
C) the redistribution of income.
D) the amount of taxes paid.
Question 2
In November 2008, the air traffic controllers who work at Guam became unionized. What would NOT be a way for the union to influence labor demand?
A) Have monthly training which improves the marginal productivity of the air traffic controllers.
B) Support minimum wage laws.
C) Creating job certification which limits the number of newly certified air traffic controllers.
D) Lobby the government to limit who can apply to be an air traffic controller in Guam to those who are certified through the union.

 Bronchoscopy. Figure illustrates physician using a bronchoscope to inspect the patient’s bronchial t
 John Lewis Krimmel’s painting of the Fourth of July in Centre Square Philadelphia (1812) shows the d
 Mobilize each metatarsal–phalangeal joint with figure-8s. Hold the tarsal just below the ...
 Which of the above illustrations shows an acidic aqueous solution
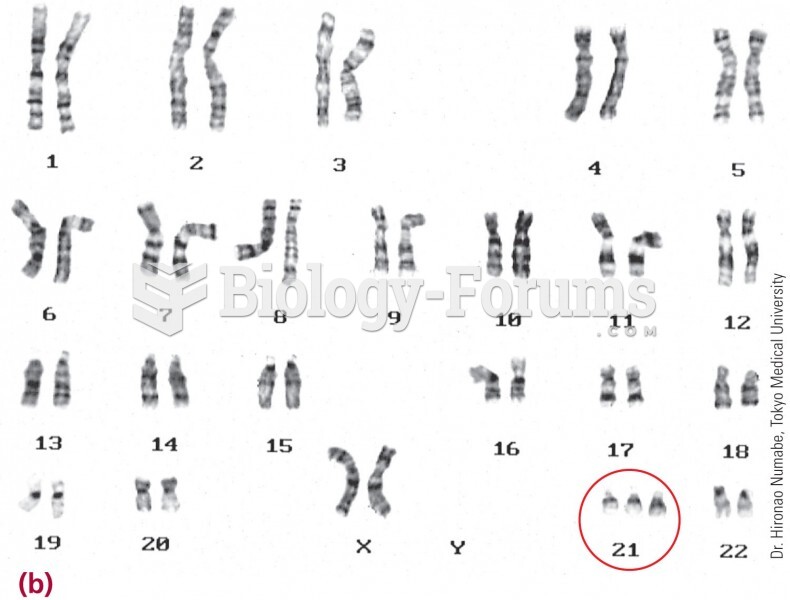 A karyotype shows this child has three copies of chromosome 21.
 Survivorship curves for people in the United States in the early 20th and early 21st centuries