This topic contains a solution. Click here to go to the answer
|
|
|

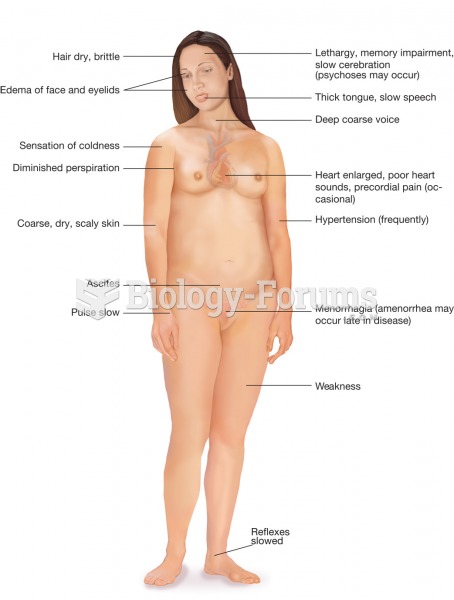 Hypothyroidism. Hyposecretion of the thyroid gland produces the symptoms that are illustrated.
 Middle adulthood can bring large-scale changes in lifestyle and interests, as illustrated by this ph
 In American Progress (1872), John Gast depicts a feminized (and eroticized) America moving westward,
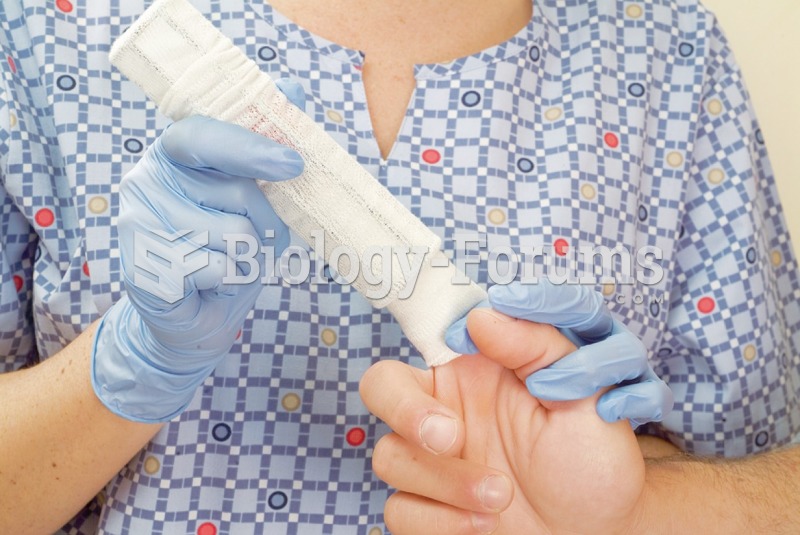 Demonstrate the Application of Triangular, Figure-Eight, and Tubular Bandages
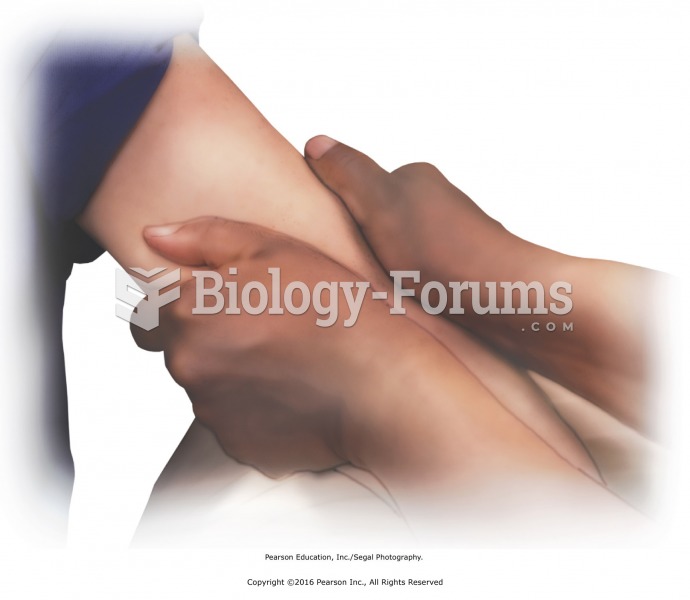 Gently squeeze along the length of the arm with both hands, moving down the arm from shoulder to ...
 A 1.5-kg playground ball is moving with a velocity of 3.0 m/s directed 30 below the horizontal ...