This topic contains a solution. Click here to go to the answer
|
|
|

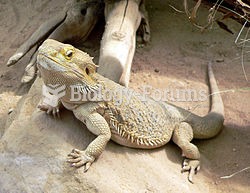 Central bearded dragon, Pogona vitticeps
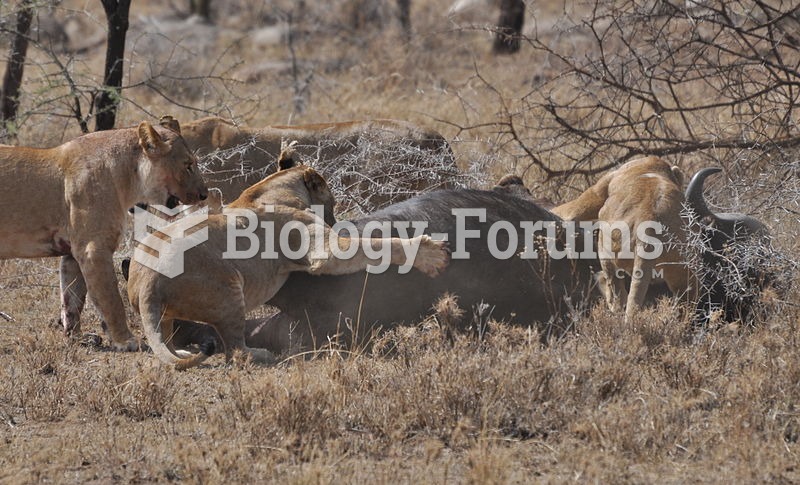 Four lions take down a cape buffalo in the central Serengeti, Tanzania
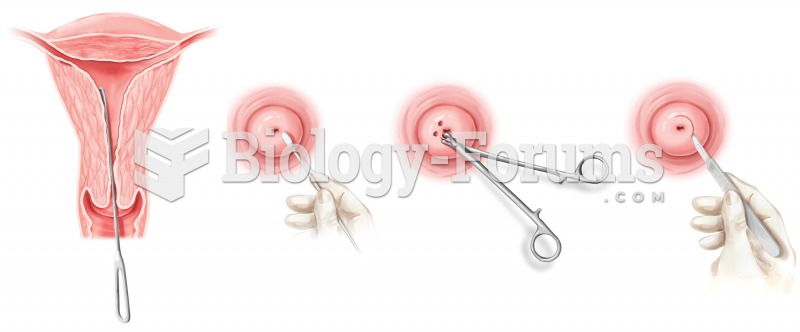 Biopsy. Various forms of gynecological biopsy are shown.
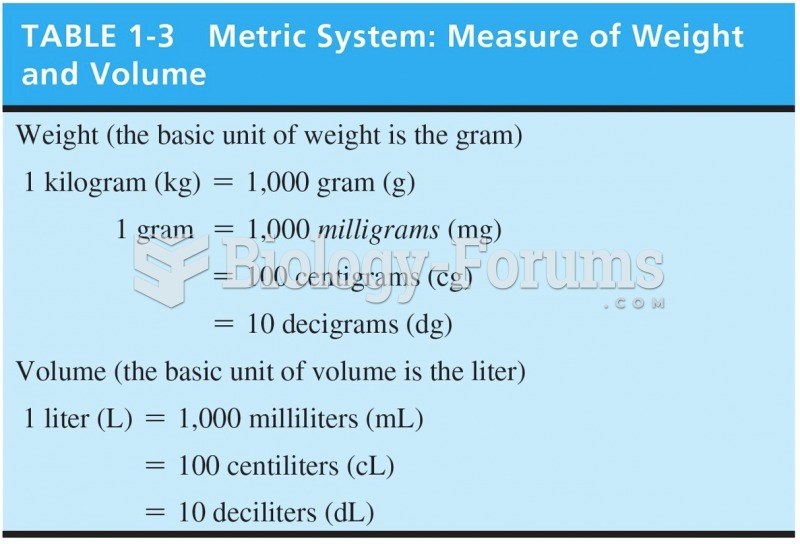 Metric System: Measure of Weight and Volume
 A 40.0-kg crate is being raised by means of a rope. Its upward acceleration is 2.00 m/s2. What ...
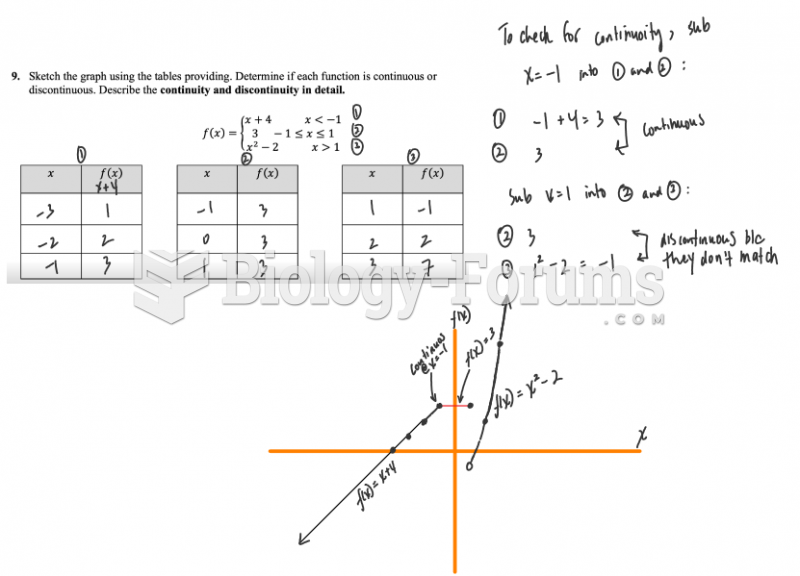 Sketch the graph using the tables providing. Determine if each function is continuous or ...