|
|
|

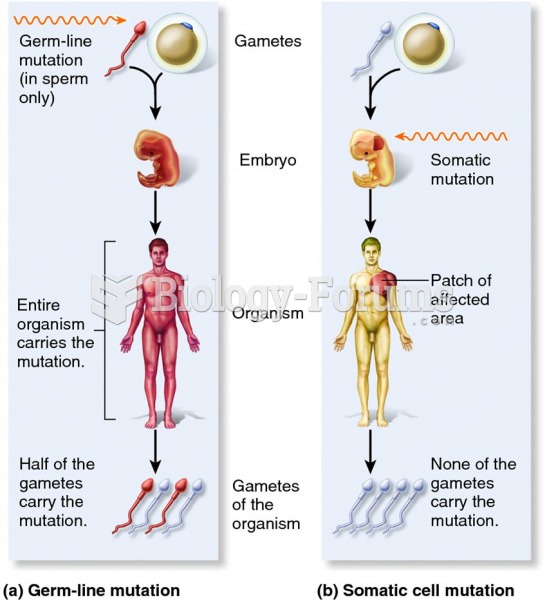 The effects of germ-line versus somatic cell mutations.
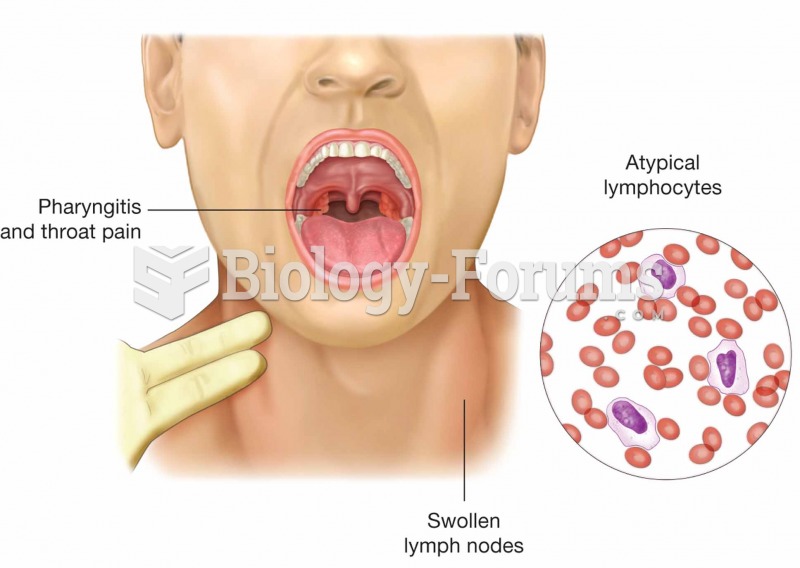 Mononucleosis is caused by the Epstein–Barr virus. Symptoms of the infectious disease are swollen pa
 Scaling the Earth down to the size of a basketball, the Moon is roughly the size of a tennis ball. T
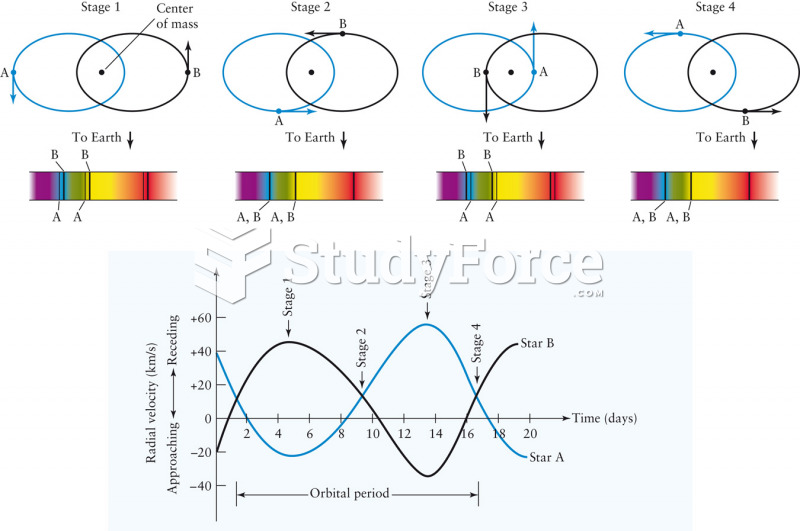 Spectral Line Motion in Binary Star Systems
 The S-curve in the human vertebral column--a result of the evolution of bipedality--makes humans hig
 Are reality shows “real”? Does the media tell the “truth”?