In the above figure, the Lorenz curve for income is shown. If the data used are from the United States, and the U.S. Lorenz curve for wealth was added to the diagram, it would be
A) further from the line of equality than the Lorenz curve for income.
B) closer to the line of equality than the Lorenz curve for income.
C) above the line of equality.
D) the same as the Lorenz curve for income.
Question 2
An increase in the quantity of money shifts the aggregate demand curve rightward.
Indicate whether the statement is true or false

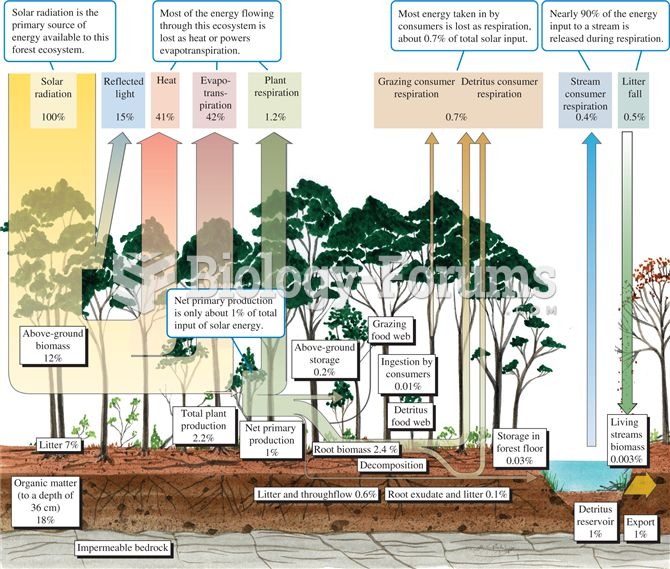 Energy budget for a temperate deciduous forest (data from Gosz et al. 1978).
 The anterior pituitary is sometimes called the master gland because it secretes many hormones that r
 Dimensions for gathering data
 Some IAC units are purchased with the housing as shown. Carbon buildup in these passages can cause ...
 Colossal Figure of Akhenaten
 How the Distribution of Education Affects the Distribution of Income