|
|
|

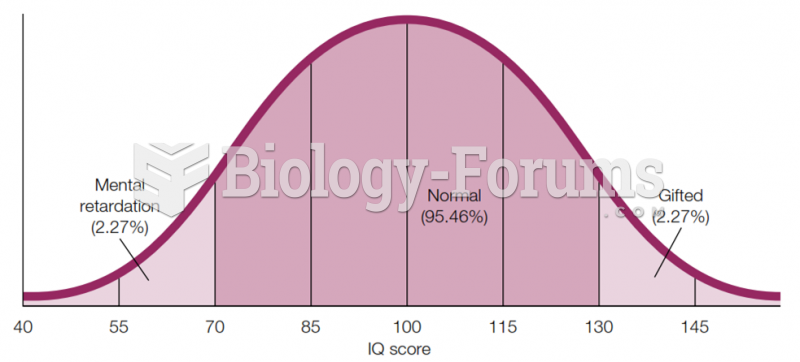 Bell Curve for Intelligence IQ scores for a population-based sample usually fall into this kind of
 Mobilize each metatarsal–phalangeal joint with figure-8s. Hold the tarsal just below the ...
 The demand for cheap coal to generate electrical power is rising
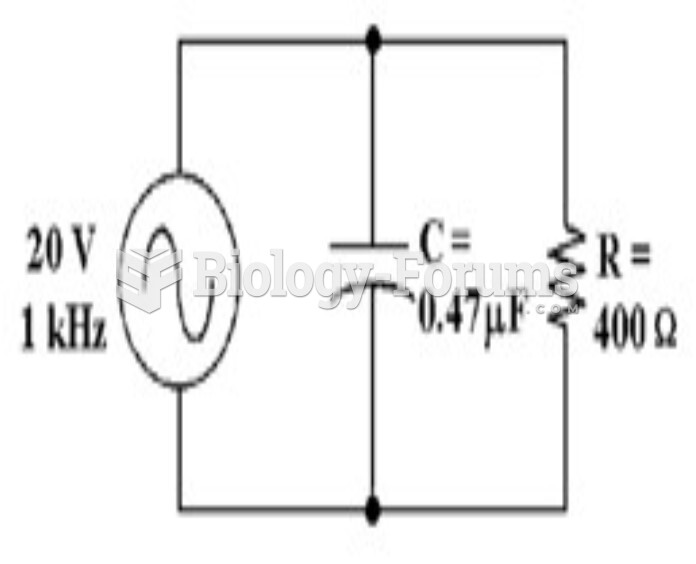 How much voltage does the resistor drop in Figure 10-2? a. 59 mV b. 19.94 V c. 20 V d. 10 V
 Construct a Lorenz curve that shows income distribution in this society.
 Effects of acidosis and alkalosis on the oxyhemoglobin dissociation curve