This topic contains a solution. Click here to go to the answer
|
|
|

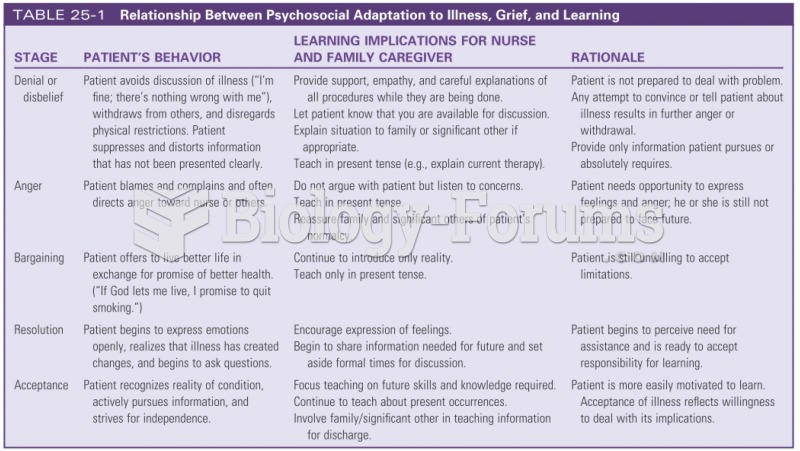 Relationship between psychosocial adaptation
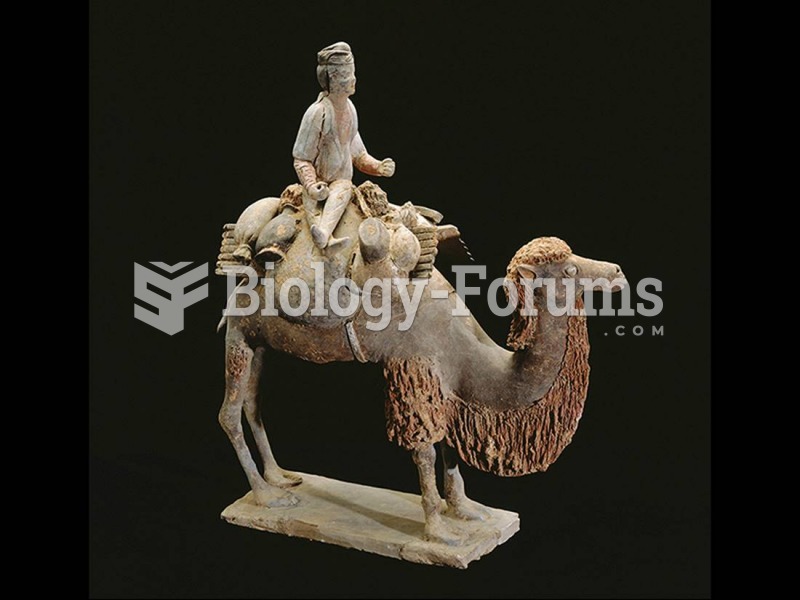 Caravaneer on a camel, China. Tang dynasty, (618–907). Polychrome terra-cotta figure.
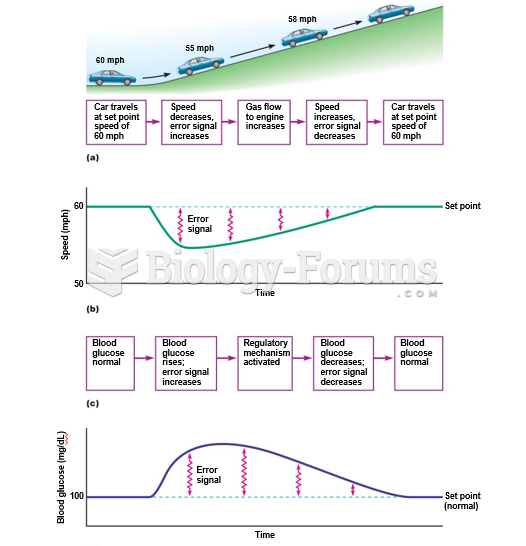 Negative feedback control of a regulated variable.
 Number of positive, negative, and neutral images recalled by younger, middle-age, and older adults. ...
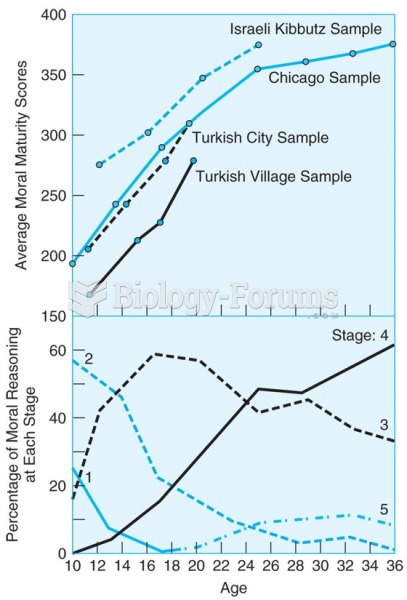 The upper panel shows that scores of four diverse samples of boys on a moral reasoning test show a ...
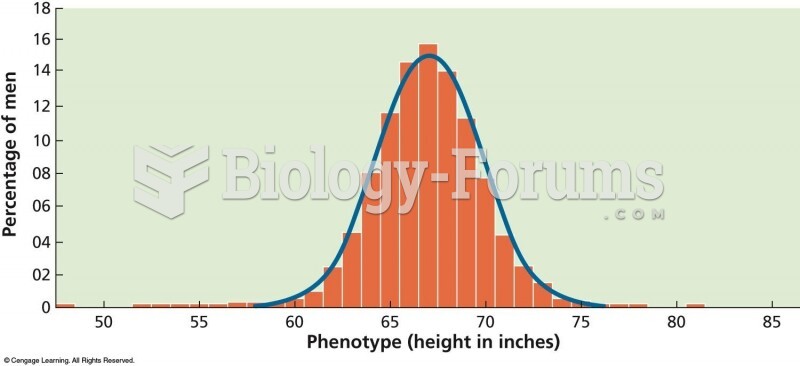 A bell-shaped, or “normal,” curve shows the distribution of phenotypes for traits controlled by ...