This topic contains a solution. Click here to go to the answer
|
|
|

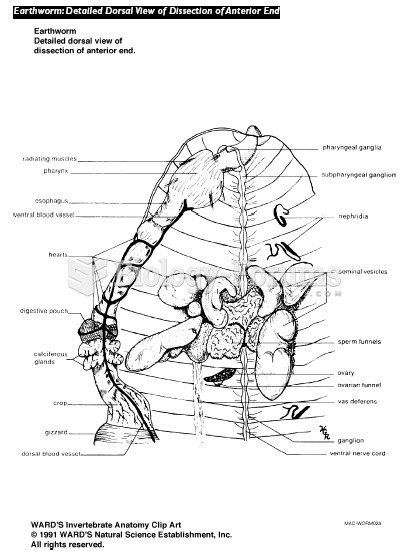 Earthworm Internal Diagram
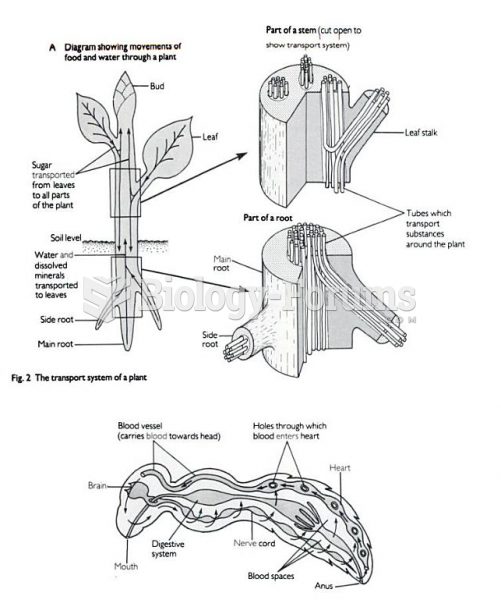 Plant Diagram
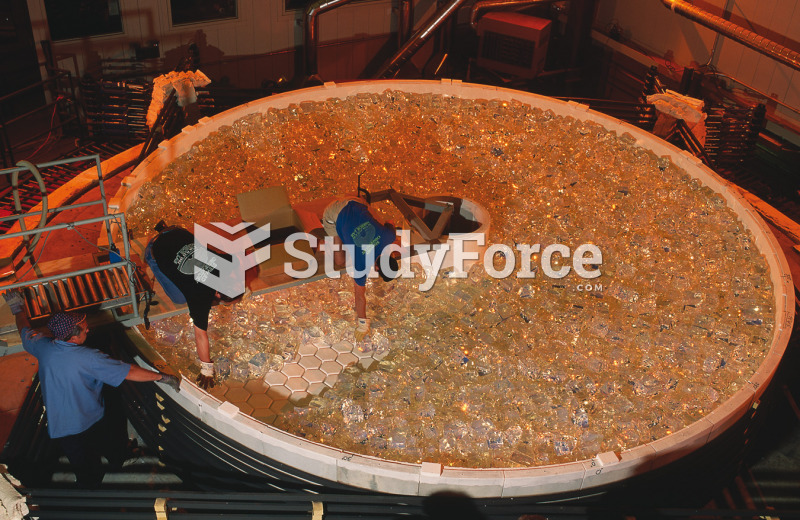 Rotating Furnace for Making Parabolic Telescope Mirrors
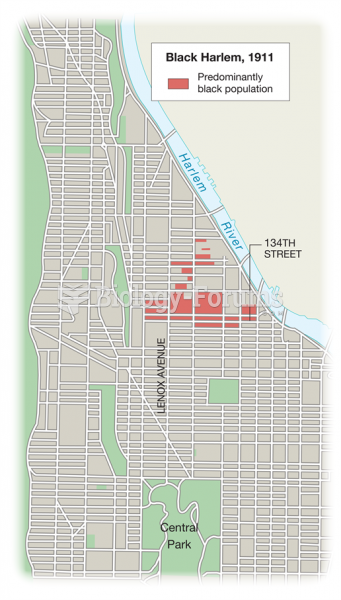 The Making of Black Harlem
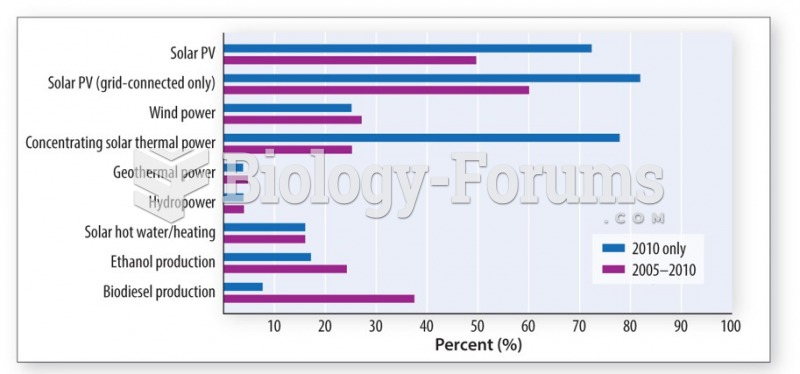 Rapid growth in the use of alternative energy seems impressive
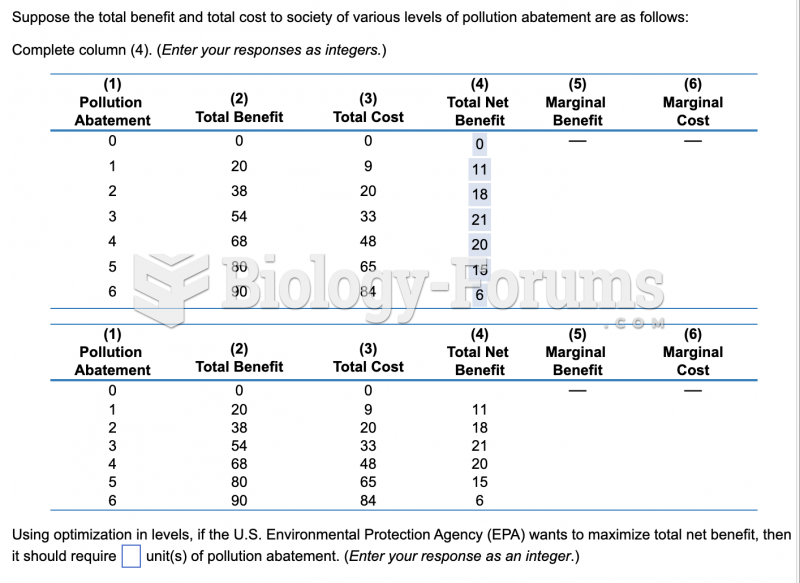 economic question