This topic contains a solution. Click here to go to the answer
|
|
|

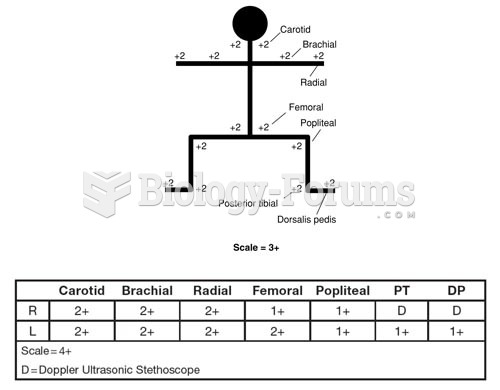 Methods to Document Peripheral Pulses A. Stick Figure Peripheral Pulse Documentation B. Tabular Peri
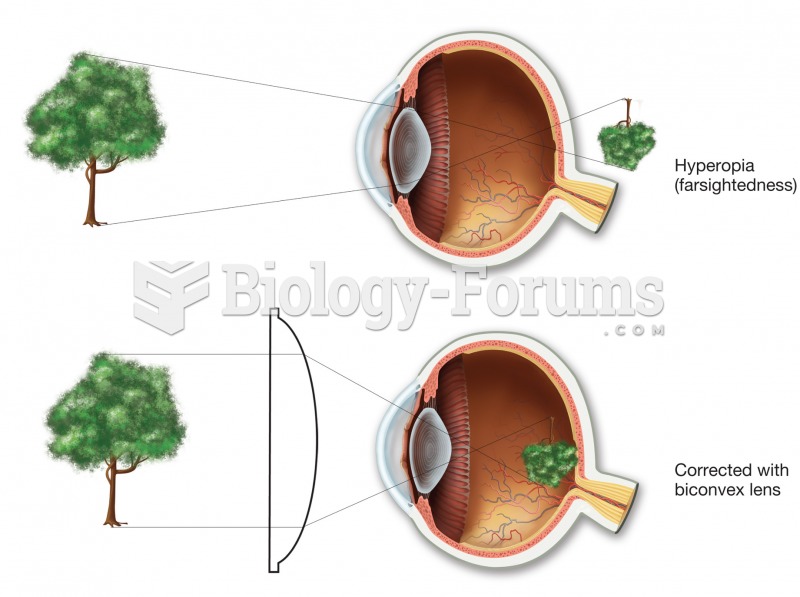 Hyperopia (farsightedness). In the uncorrected top figure, the image would come into focus behind th
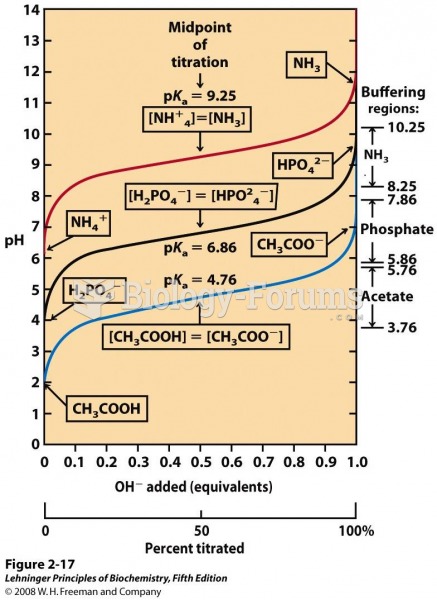 Comparison of the titration curves of three weak acids
 Demonstrate the Application of Triangular, Figure-Eight, and Tubular Bandages
 How much voltage does the resistor drop in Figure 10-2?
 What is the total number of valence electrons in a silicate ion, SiO32-?