This topic contains a solution. Click here to go to the answer
|
|
|

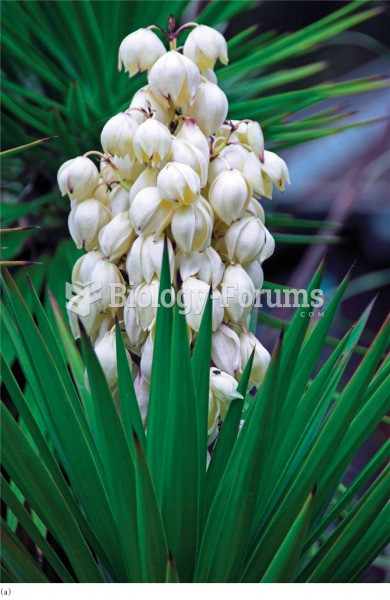 (a) Yucca baccata in full flower; (b) a Yucca moth, Tegeticula planella, ovipositing on a Yucca flow
 Figure-8s at the knuckles of the hand.
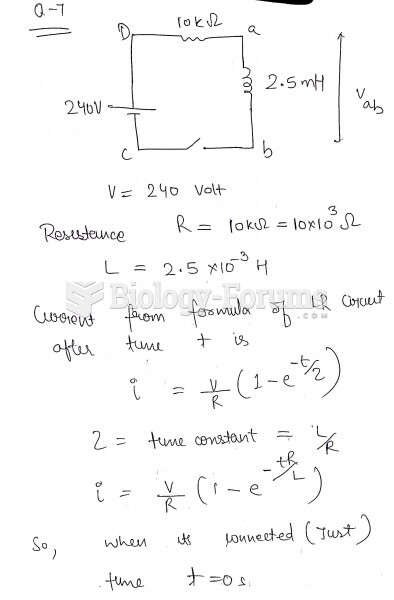 The figure shows an LR circuit with a switch and a 240-volt battery. At the instant the switch ...
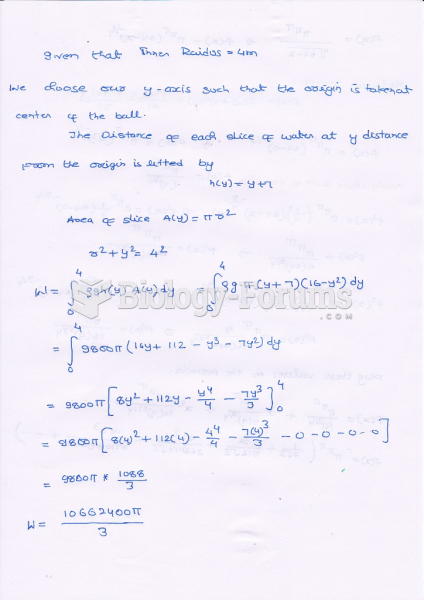 A spherical water tank with an inner radius of 4 m has its lowest point 3 m ...
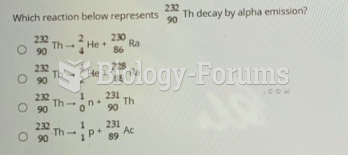 Which reaction below represents Th decay by alpha emission?
 The Hardy–Weinberg equilibrium for autosomal genes