|
|
|

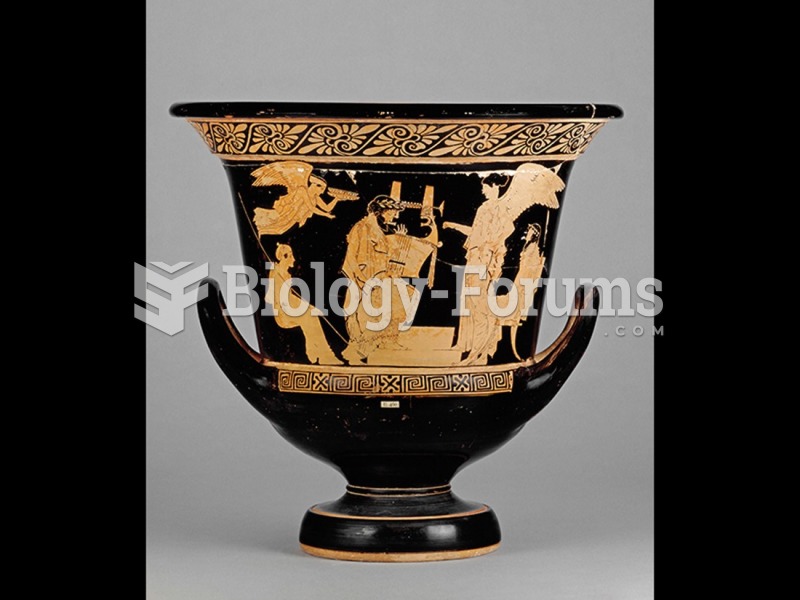 Attributed to the Manner of Peleus Painter, Red-figure calyx-krater.
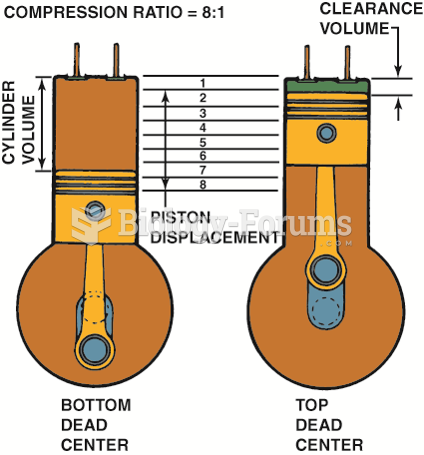 Compression ratio is the ratio of the total cylinder volume (when the piston is at the bottom of ...
 The end of a typical line wrench, which shows that it is capable of grasping most of the head of ...
 Figure of a Woman with a Drawing Showing Evidence of Original Painting and Outlining Design Scheme
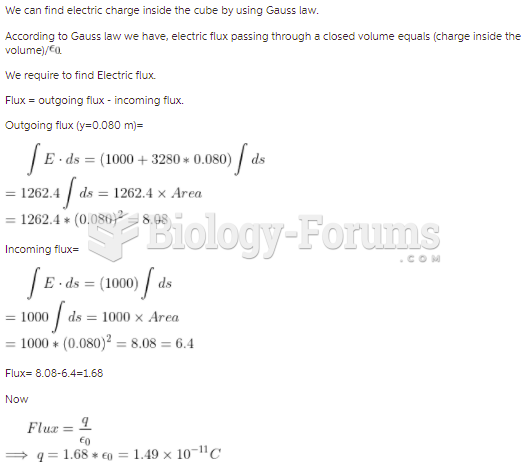 The cube of insulating material shown in the figure has one corner at the origin. Each side of ...
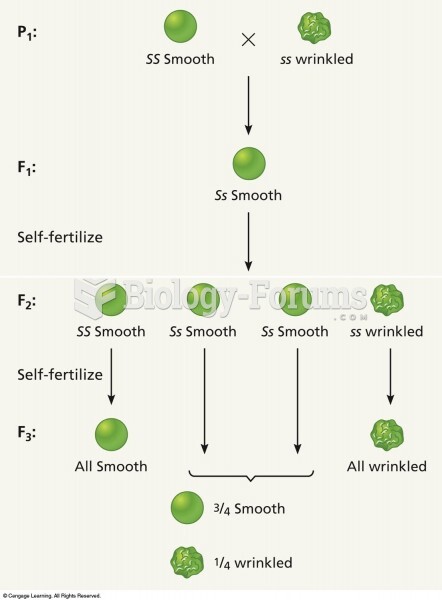 Self-crossing F2 plants to produce an F3 generation shows that there are two different genotypes amo