This topic contains a solution. Click here to go to the answer
|
|
|

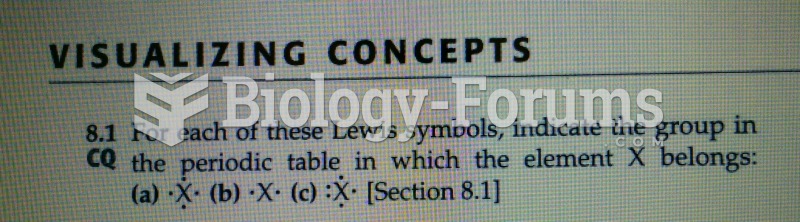 Lewis symbols,(Figure 1)
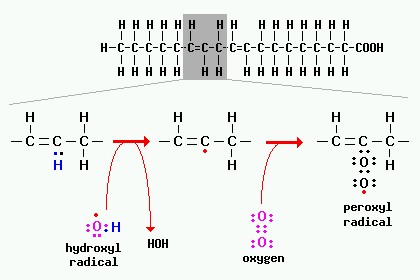 A peroxidation reaction involving a fatty acid is depicted in the figure below.
 Demonstrate the Application of Triangular, Figure-Eight, and Tubular Bandages
 EYEMA-O-BYERI (Reliquary Figure)
 Economic recession in 2008 saw a small decrease in demand
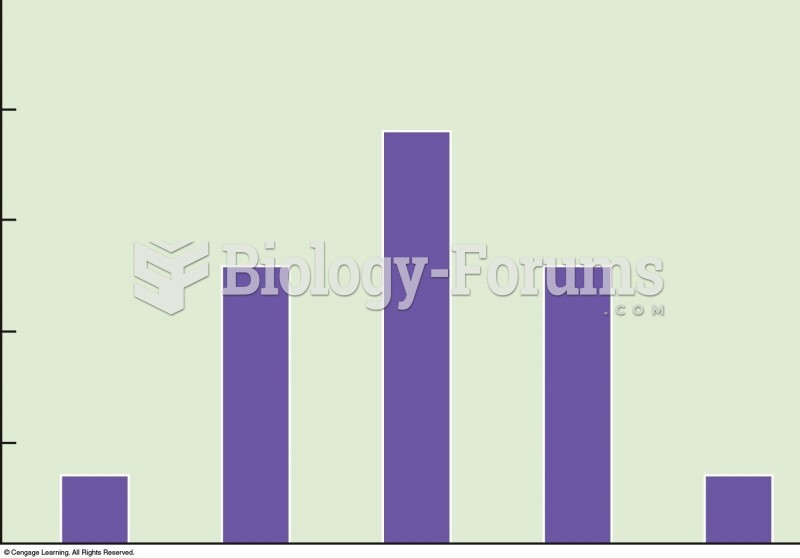 Frequency distribution of phenotypes from the possible offspring in Figure 5.7. Height of the offspr