This topic contains a solution. Click here to go to the answer
|
|
|

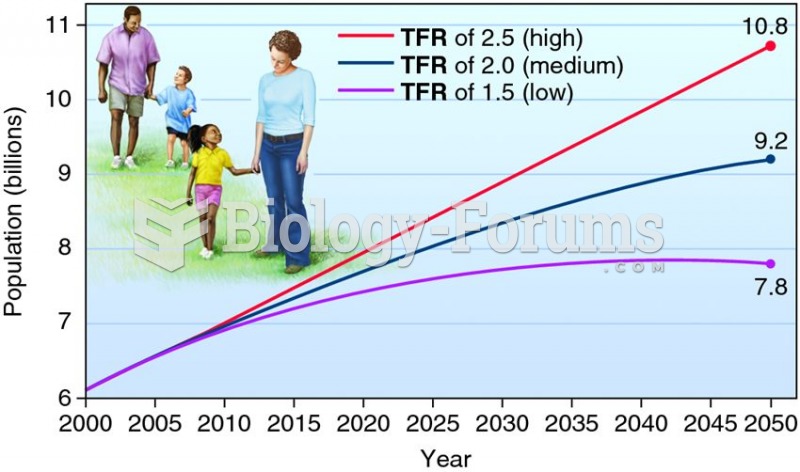 Population predictions for 2000–2050, using three different total fertility rates (
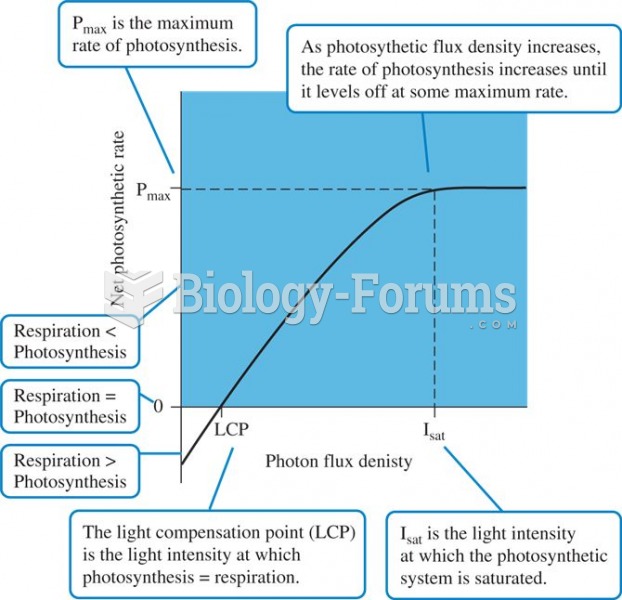 A theoretical photosynthetic response curve.
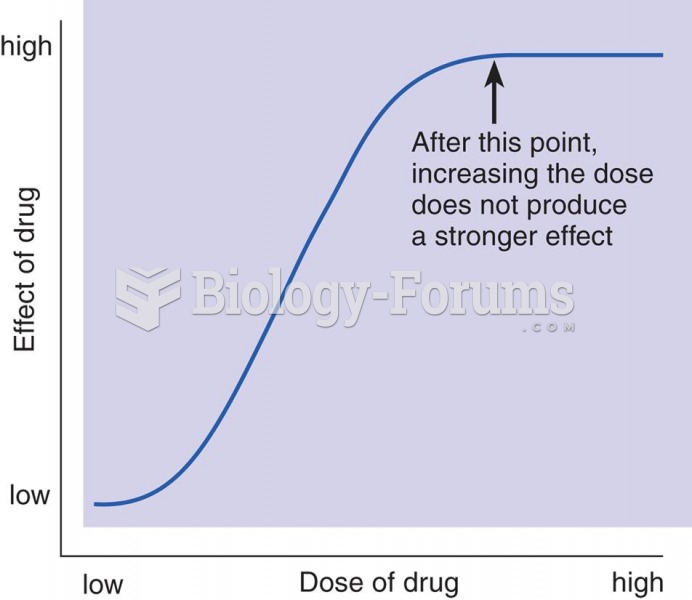 A Dose-Response Curve
 Demonstrate the Application of Triangular, Figure-Eight, and Tubular Bandages
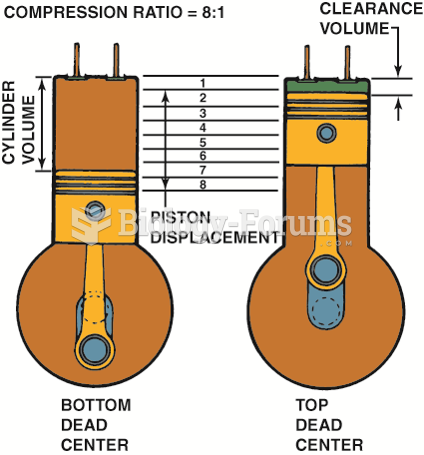 Compression ratio is the ratio of the total cylinder volume (when the piston is at the bottom of ...
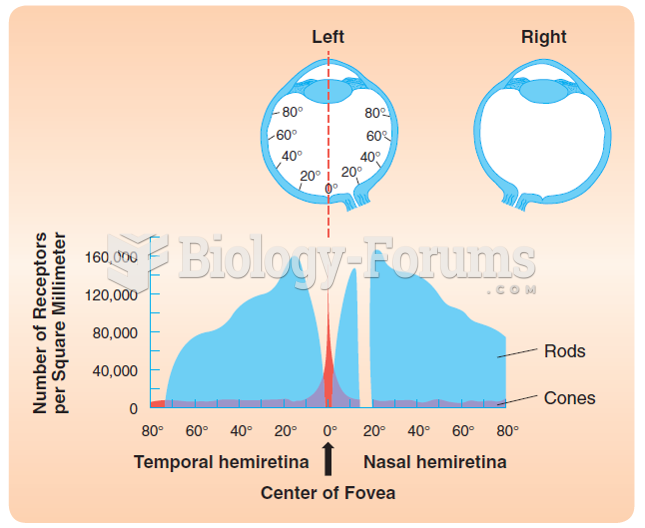 The distribution of cones and rods over the human retina. The figure illustrates the number of cones ...