The figure above shows the relationship between the journey length and the cost of trip per mile. The curve becomes flatter because as the journey length increases,
A) the cost per mile increases.
B) the fall in the cost per mile becomes greater.
C) the cost per mile remains unchanged.
D) the cost per mile decreases.
E) the fall in the cost per mile becomes smaller.
Question 2
If we look at real and nominal interest rates in the United States since 1971, we see that
A) the real interest rate has almost always been less than the nominal interest rate because of inflation.
B) at times the nominal interest rate has been greater than the real interest rate and at times has been less than it.
C) the difference between the nominal and real interest rates has widened during the 1990s because of inflation.
D) the nominal interest rate has always been less than the real interest rate because of inflation.
E) both the nominal and real interest rates were negative in the highly inflationary 1970s.

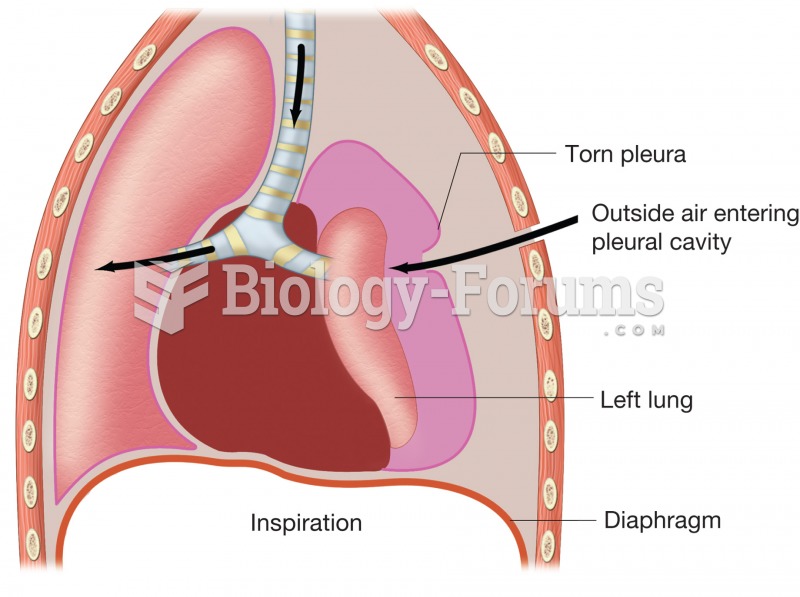 Pneumothorax. Figure illustrates how puncture of thoracic wall and tearing of pleural membrane allow
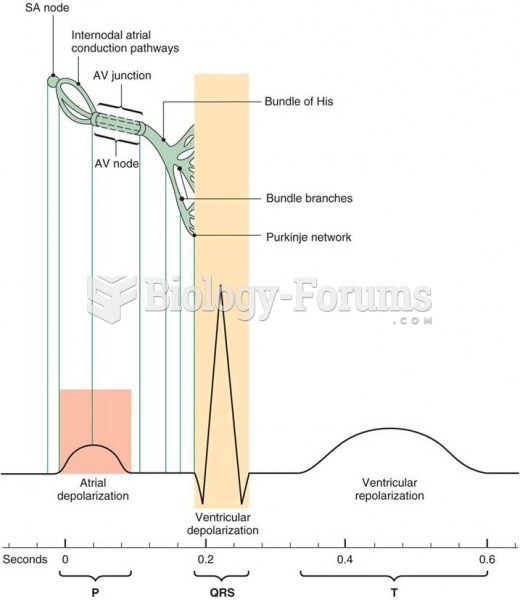 Relationship of the electrocardiogram to electrical conduction in the heart
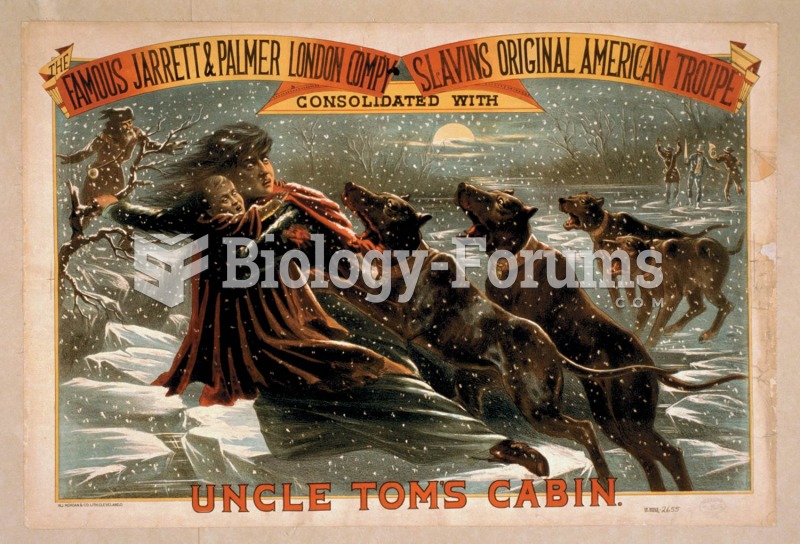 Harriet Beecher Stowe’s novel, Uncle Tom’s Cabin, became a staple of the mid-nineteenth-century thea
 The drum shown in the figure has a radius of 0.40 m and a moment of inertia of 2.3 kg m2about ...
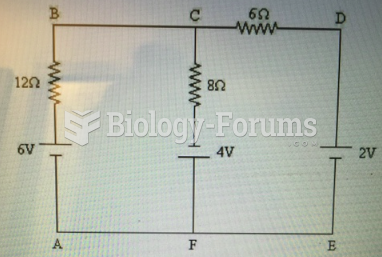 Identify the junction nodes in the circuit shown in Figure 21-1.