This topic contains a solution. Click here to go to the answer
|
|
|

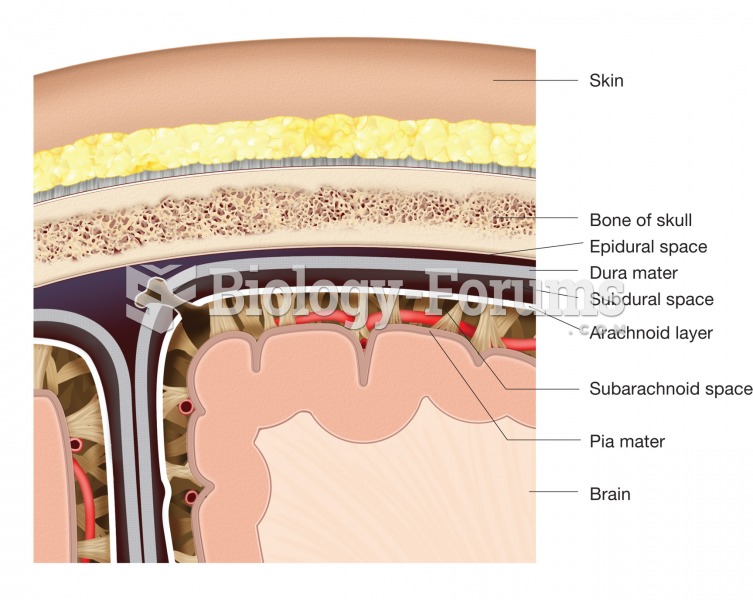 The meninges. This figure illustrates the location and structure of each layer of the meninges and t
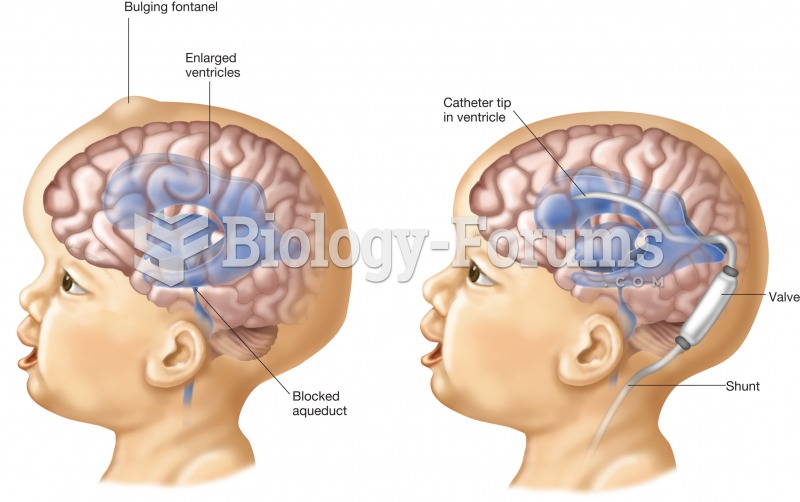 Hydrocephalus. The figure on the left is a child with the enlarged ventricles of hydrocephalus. The
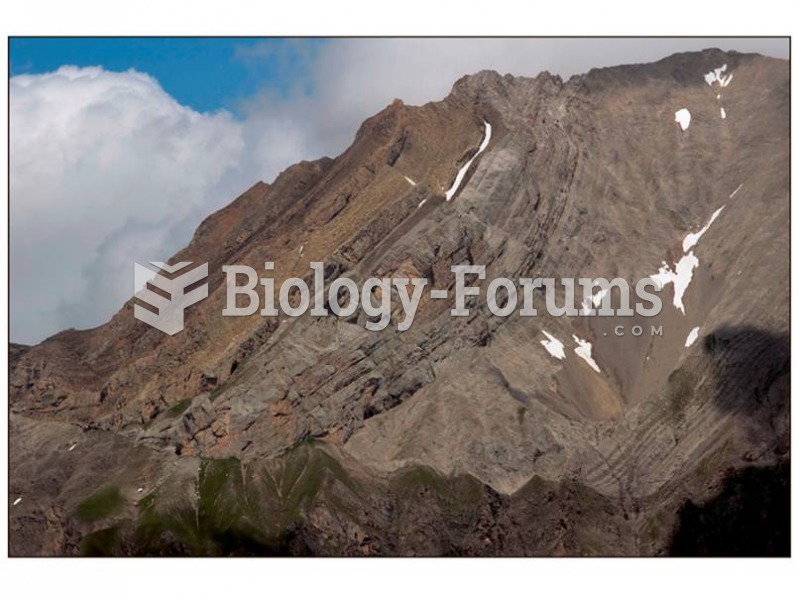 The paleoanthropologist must understand these deformations in order to figure out which strata a fos
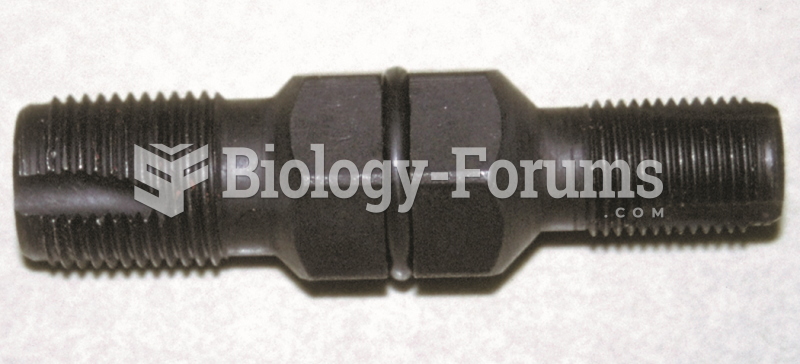 A spark plug thread chaser is a low-cost tool that hopefully will not be used often, but is ...
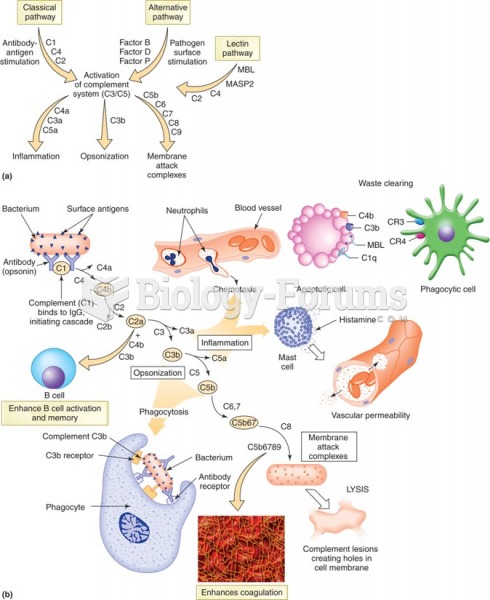 Three pathways of complement combined. (a) Figure shows a summary of how each pathway proceeds. (b) ...
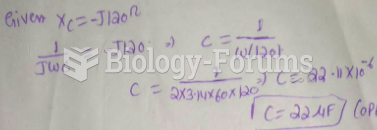 If the frequency equals 60 Hz in Figure 10-1, what is the value of capacitance?