The graph illustrates the demand for peanuts. Peanuts are a normal good because the
A) demand curve shows that if the price of peanuts rises, there is a movement along the demand curve to a lower quantity demanded.
B) demand for peanuts increases when income increases.
C) demand for peanuts increases when the price of one of its substitutes rises.
D) demand curve for peanuts slopes downward.
E) peanuts have both substitutes and complements.
Question 2
In order for any given commodity to be considered money, it has to
A) be issued and controlled by some governmental institution.
B) have some intrinsic value.
C) be generally acceptable as a means of payment.
D) be used in barter transactions.
E) be convertible into gold or silver.

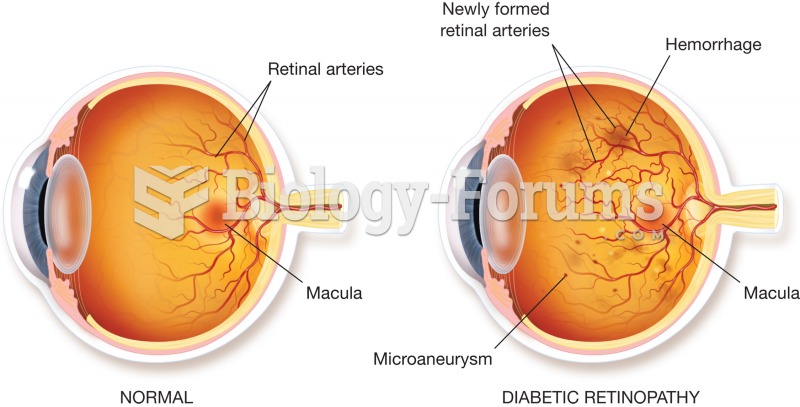 Retinopathy. Illustration of a normal retina (left) and a diseased retina (right). The diseased reti
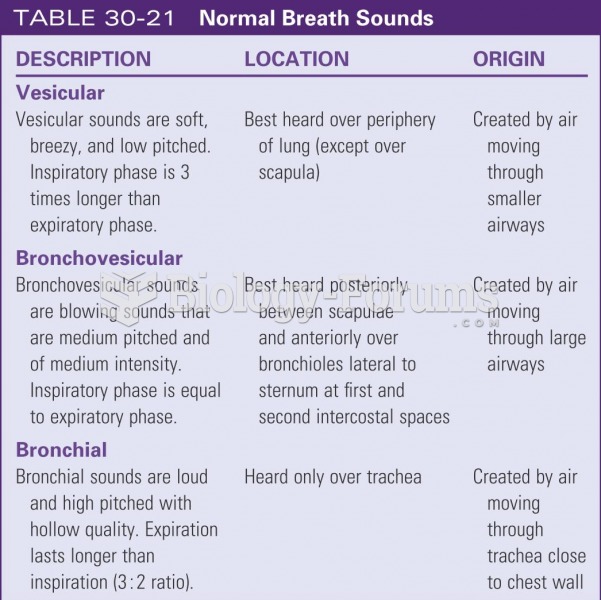 Normal breath sounds
 Neutrophils in a normal blood smear.
 How to graph quadratic equations that are in factored form y=a(x−r)(x−s)
 Humburger is a good source of niacin , vitamin B6 and pantothenic acid
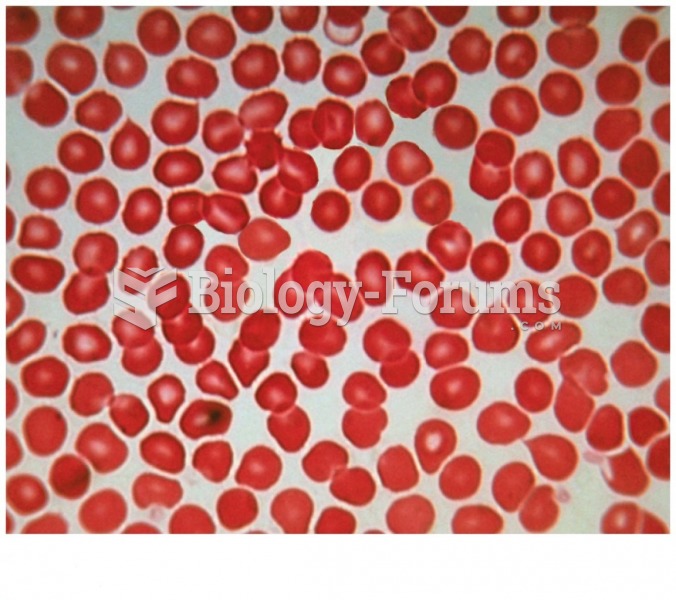 Normal Red Blood Cells