This topic contains a solution. Click here to go to the answer
|
|
|

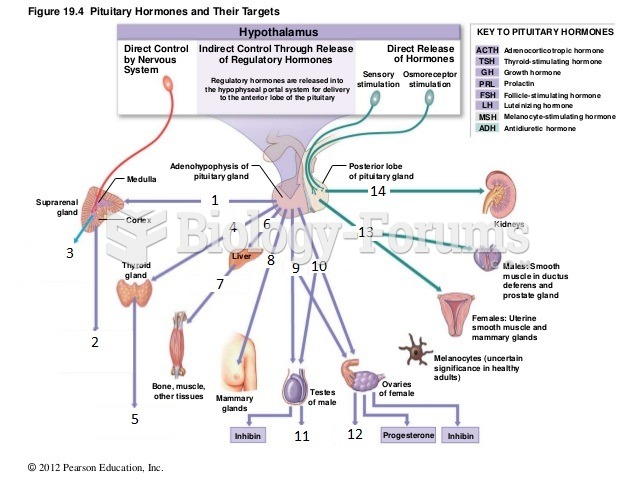 figure 18-1 pituitary hormones
 Demonstrate the Application of Triangular, Figure-Eight, and Tubular Bandages
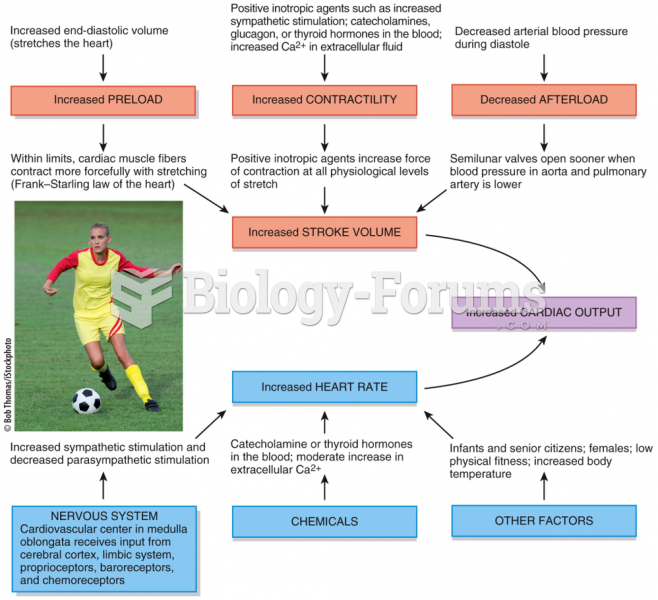 Factors that Increase Cardiac Output
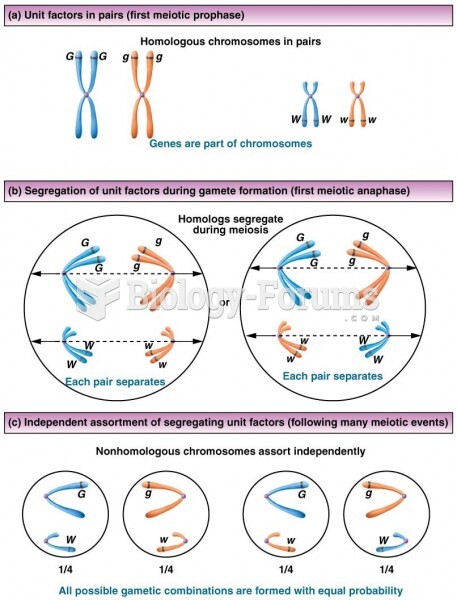 Illustrated correlation between the Mendelian postulates of unit factors
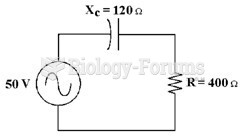 If the frequency equals 60 Hz in Figure 10-1, what is the value of capacitance?