This topic contains a solution. Click here to go to the answer
|
|
|

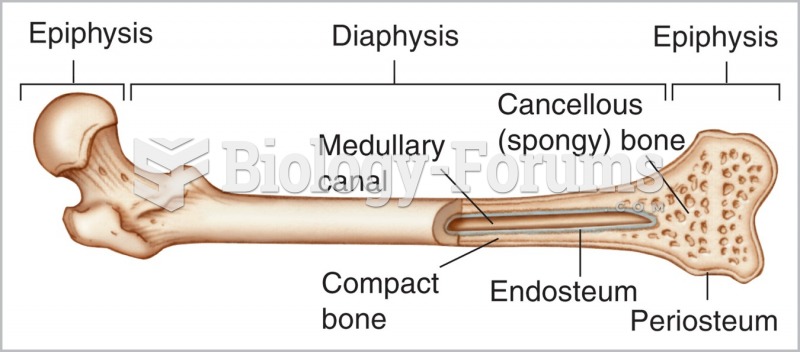 The features found in a long bone.
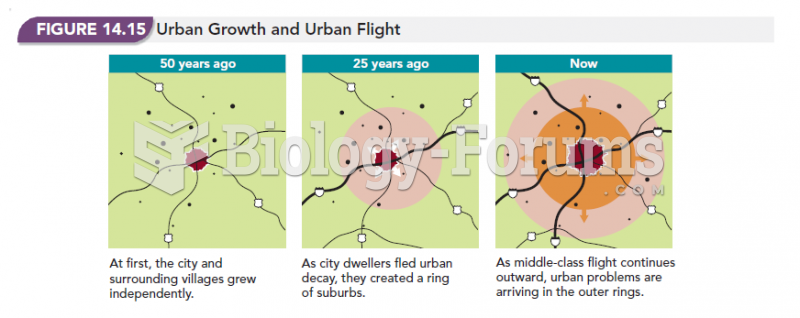 Urban Growth and Urban Flight
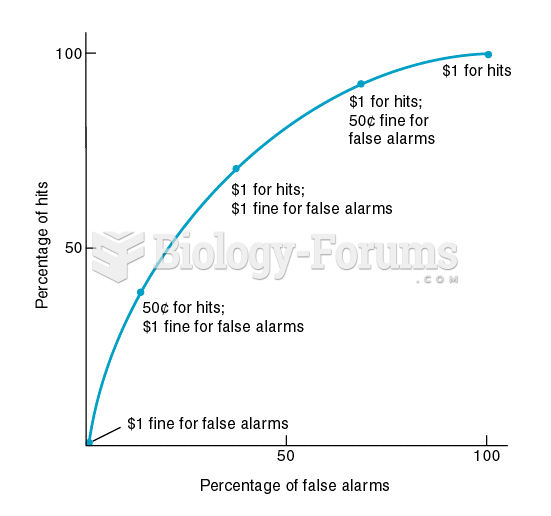 A Receiver-Operating-Characteristic (ROC) Curve
 economic question
 economic question
 economic question