Answer to Question 1
The figure depicts the effect of a permanent increase in the money supply starting from full employment equilibrium. After the initial increase in the money supply and the move of the AA curve to the right from AA1 to AA2, a steadily increasing price level shifts the AA and the DD schedules to the left until a new long-run equilibrium is reached. Note that point 3 is above point 1, because Ee is permanently higher after a permanent increase in the money supply. The expected exchange rate, Ee, has risen by the same percentage as Ms. Notice that along the adjustment path between the initial short-run equilibrium (point 2 ) and the long-run equilibrium (point 3 ) the domestic currency actually appreciates (from E2 to E3 ) following its initial sharp depreciation (from E1 to E2).
Answer to Question 2
A

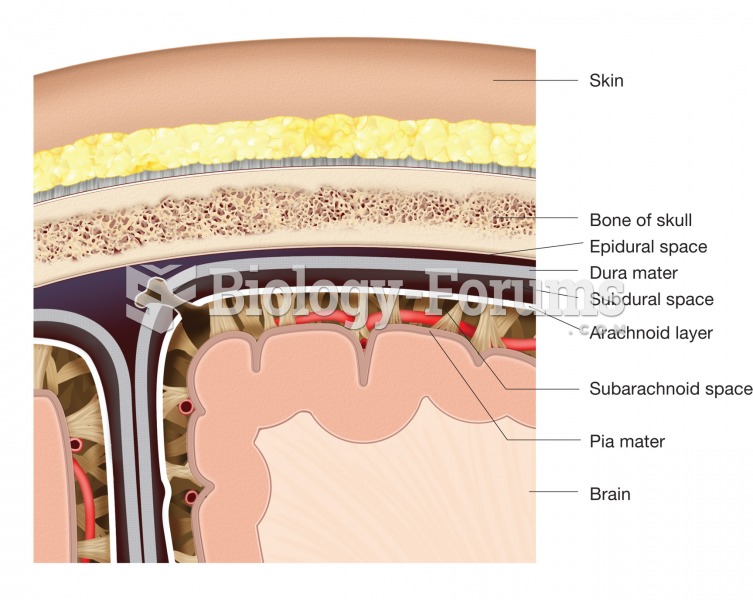 The meninges. This figure illustrates the location and structure of each layer of the meninges and t
 Mobilize hand and wrist joints. Apply scissoring to knuckles and figure-8s to fingers. Holding the ...
 Genetics Question
 Economics question
 economic question