This topic contains a solution. Click here to go to the answer
|
|
|

 Acromegaly. Acromegaly is a metabolic disorder in which excessive amounts of growth hormone are secr
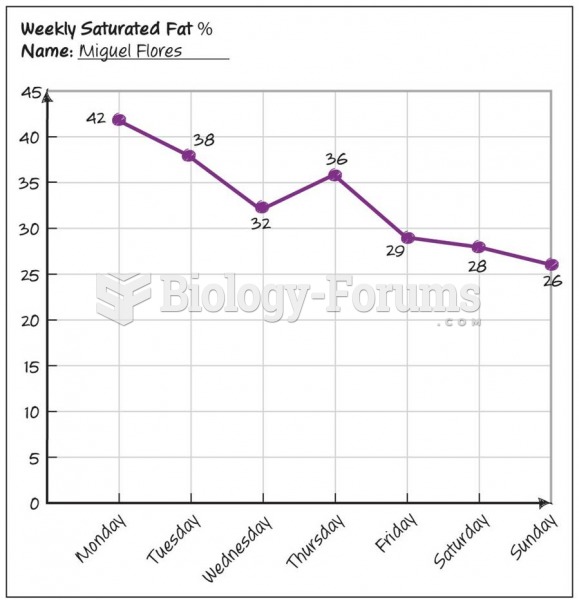 Progression Graph
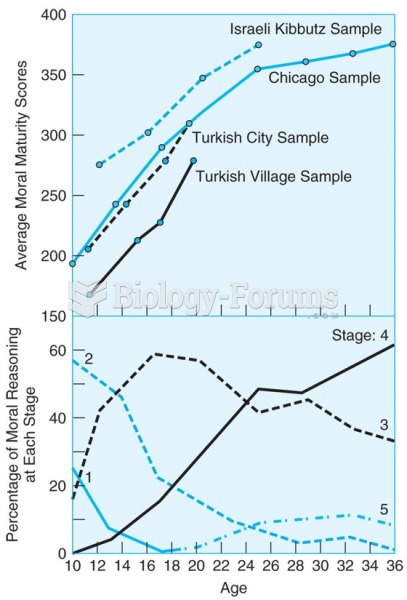 The upper panel shows that scores of four diverse samples of boys on a moral reasoning test show a ...
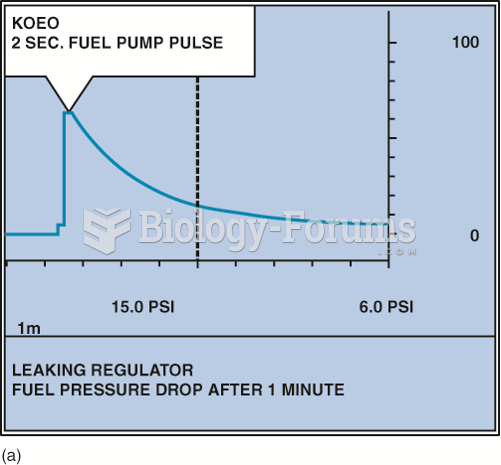 A fuel-pressure graph after key on, engine off (KOEO) on a TBI system.
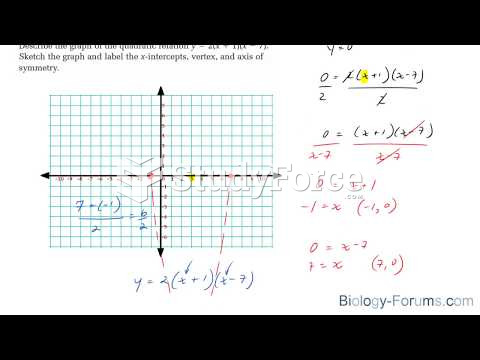 How to graph quadratic equations that are in factored form y=a(x−r)(x−s)
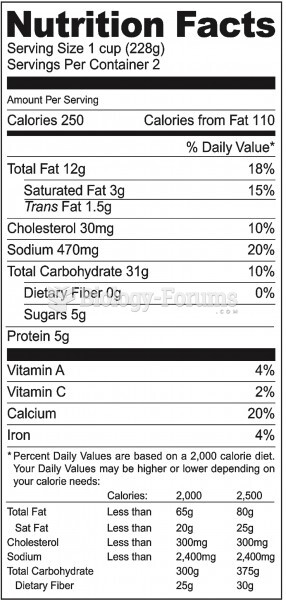 Food Labels Now Show Trans Fats