This topic contains a solution. Click here to go to the answer
|
|
|

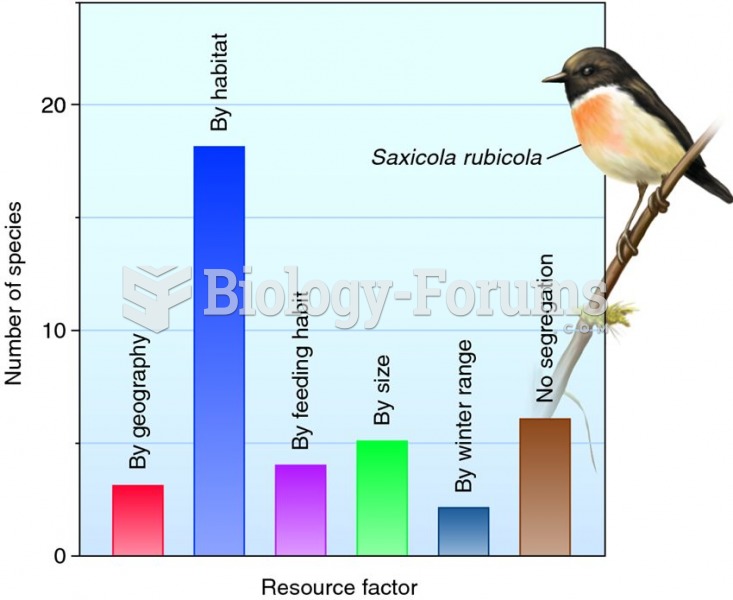 Segregation according to resource factor among 40 species of British passerine birds.
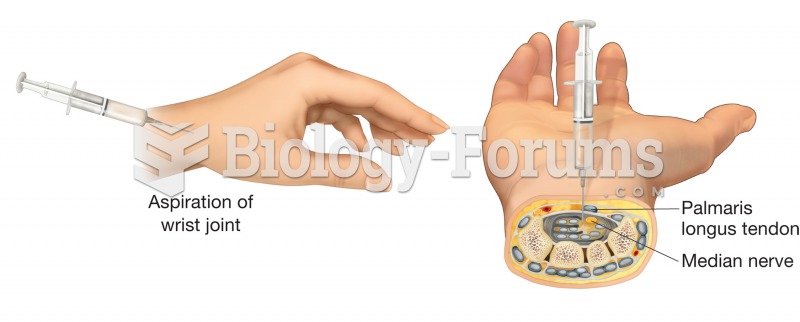 Arthrocentesis. The aspiration of fluid is a common treatment for joint injuries resulting in inflam
 Miller-Urey Experiment Updated
 Disorders and Treatment of the Thyroid Gland
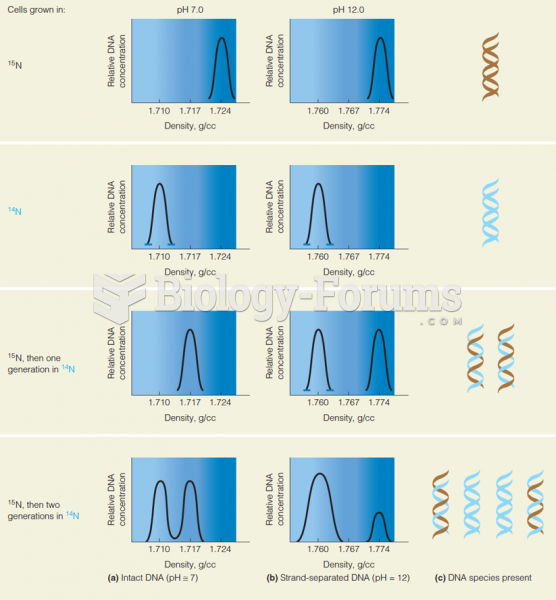 The Meselson–Stahl experiment proves DNA replicates semiconservatively
 Dilution Factor