The production possibilities curve illustrates:
a. the minimum quantity of two resources necessary to produce a given level of output.
b. that when resources are currently being used inefficiently, it is possible to increase production of one good only by sacrificing some of another good.
c. that when resources are currently being used efficiently, it is possible to increase production of one good only by sacrificing some of another good.
d. the minimum quantities of output that can be produced using available resources.
Question 2
Which of the following is likely to increase the equilibrium real interest rate?
a. greater tax benefits for IRAs
b. technological improvement creating profitable investment opportunities
c. elimination of an investment tax credit for corporations
d. an increased consumption tax

 Review Bundling, Add-on Codes, and Quantity Edits
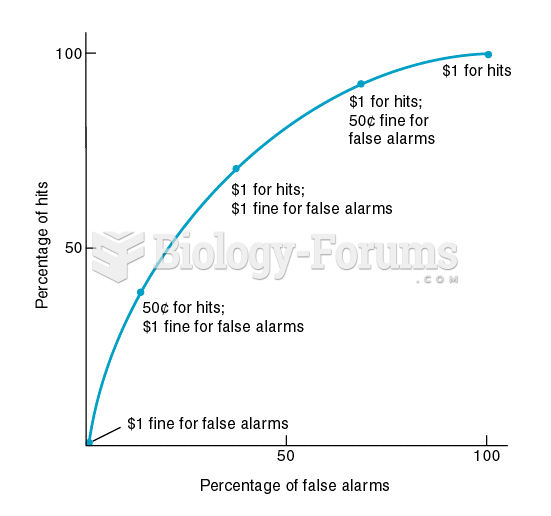 A Receiver-Operating-Characteristic (ROC) Curve
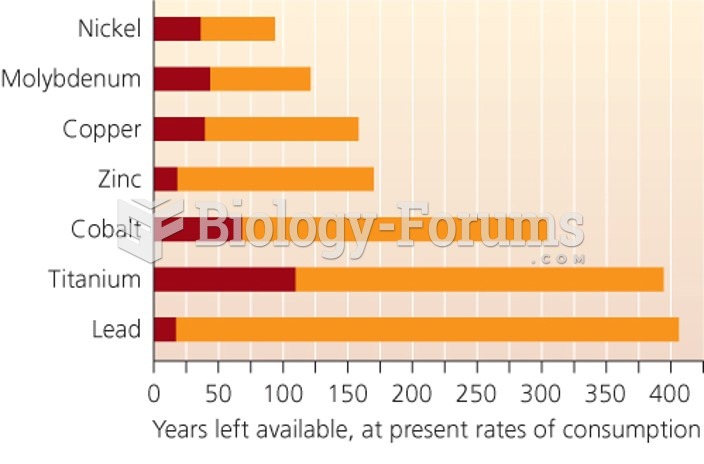 Minerals are nonrenewable resources in limited supply
 Role of Factors of Production in Determining Output per Worker, 2009
 Production and Prices in Richland and Poorland
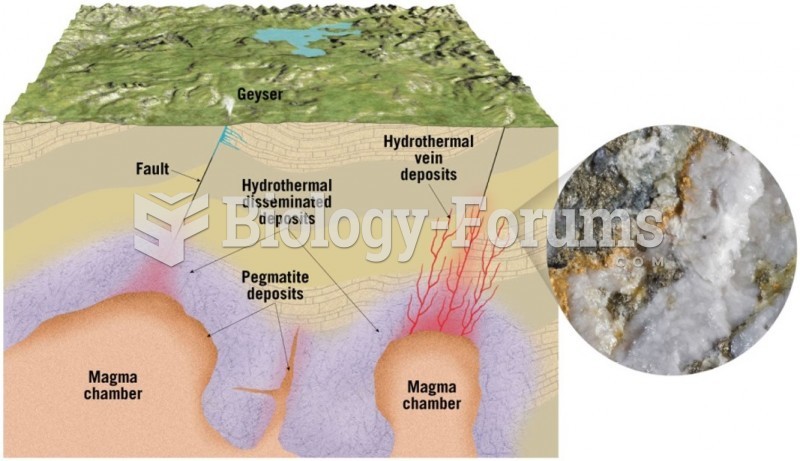 Resources from Rocks and Minerals