This topic contains a solution. Click here to go to the answer
|
|
|

 Critical thinking involves analysis in which the nurse examines patient data available from a variet
 Systems Analysis and Design, 10th Edition
 You deposit $2000 each year into an account earning 4% interest compounded annually. How much ...
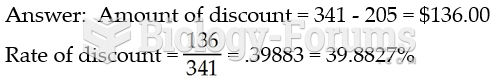 Compute the rate of discount allowed on a rotor-tiller that lists for $341.00 and is sold for ...
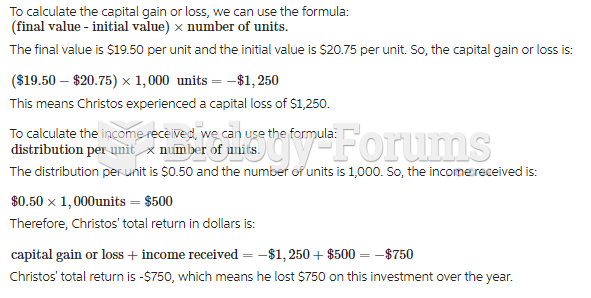 One year ago, Christos bought 1000 units of the Dominion Aggressive Growth Fund at $20.35 per ...
 Use of reporter gene in promoter analysis of the even-skipped (eve) gene