This topic contains a solution. Click here to go to the answer
|
|
|

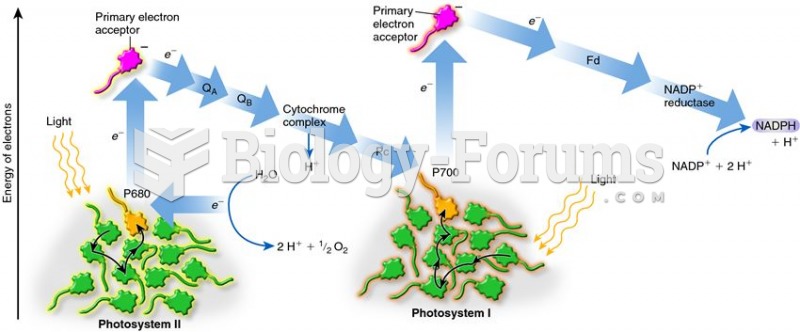 The Z scheme, which depicts the energy of an electron as it moves from photosystem II to NADP+
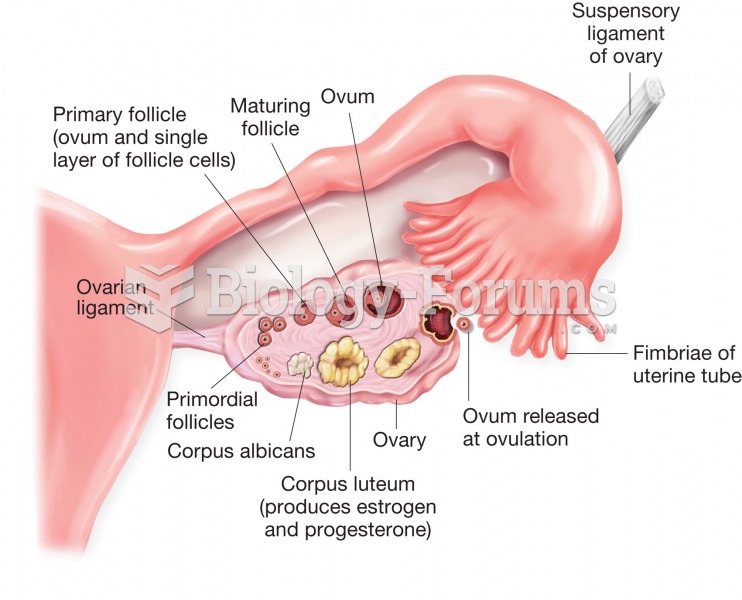 Structure of the ovary and uterine (fallopian) tube. Figure illustrates stages of ovum development a
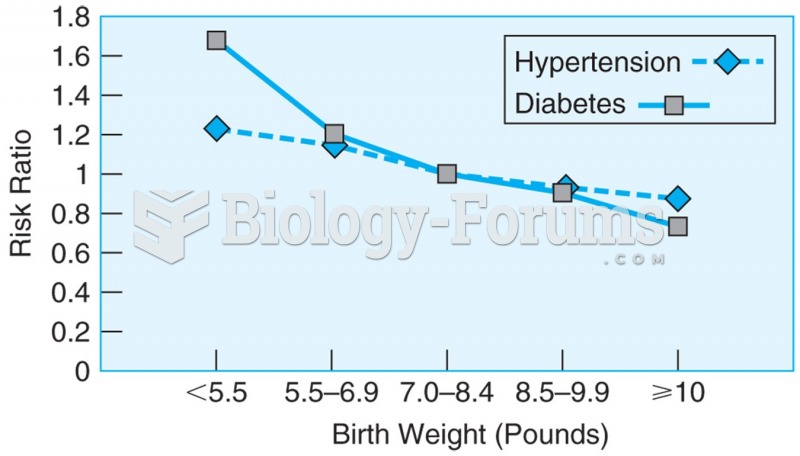 Data from more than 22,000 men over the age of 40, showing the relationship between birth weight and ...
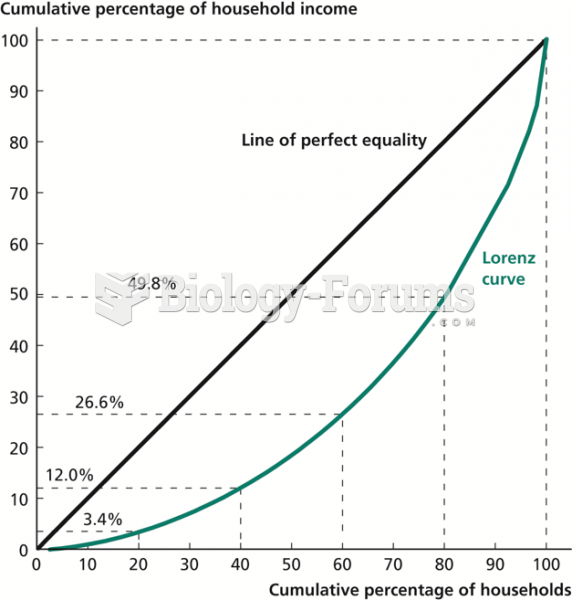 The Lorenz Curve for the United States, 2009
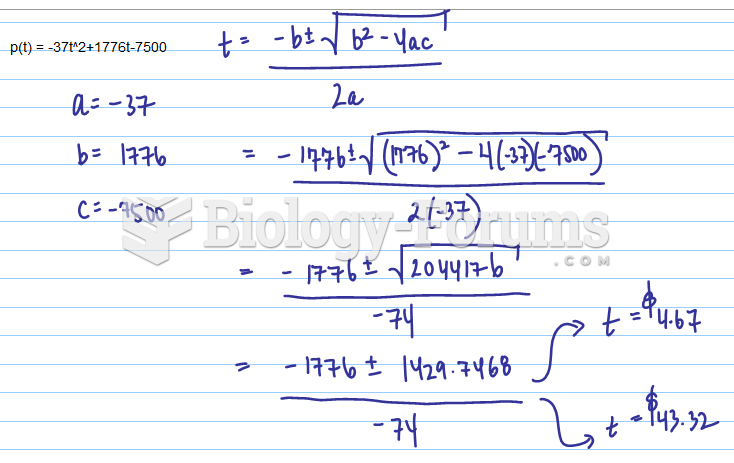 The profit, p(t), made at a fair depends on the price of the ticket, t. The profit is modelled ...
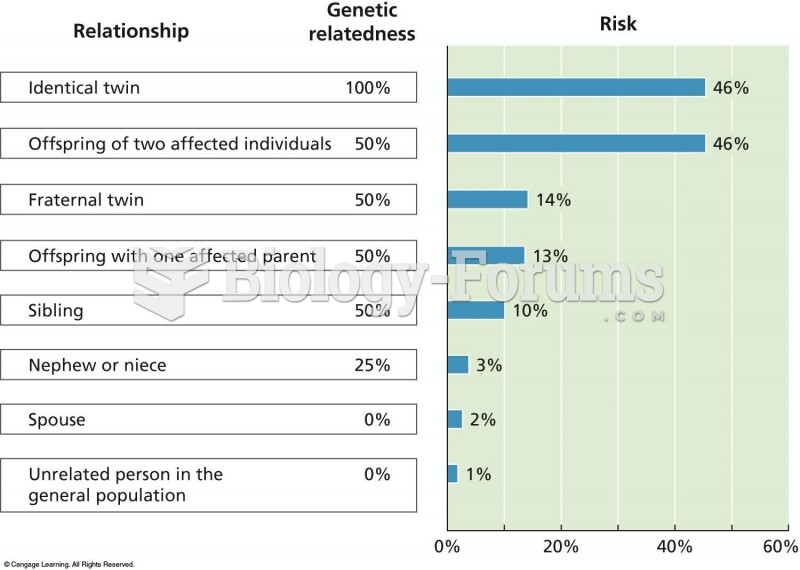 The lifetime risk for schizophrenia varies with the degree of relationship to an affected individual