In a graphic relationship, shifts in a curve are caused by a change in:
a. the slope of the curve.
b. a factor not measured on the axes of the graph.
c. one of the factors measured on either axes of the graph.
d. any factor, whether measured on the axes of the graph of not.
Question 2
Assume there is a relationship between two variables and the other-variables-held constant assumption (ceteris paribus) is relaxed. We would expect that the line representing this relationship would:
a. change from inverse to direct.
b. change from direct to inverse.
c. have a greater number of data points.
d. change its location.

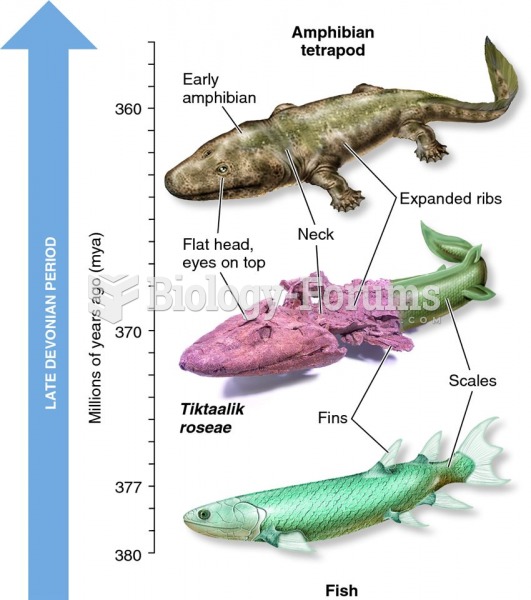 Evolutionary change in the tetrapod lineage, showing a transitional form.
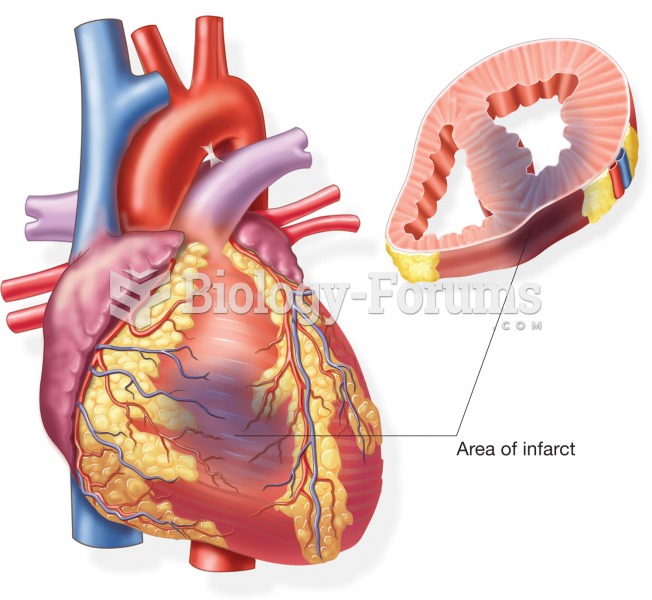 External and cross-sectional view of an infarct caused by a myocardial infarction.
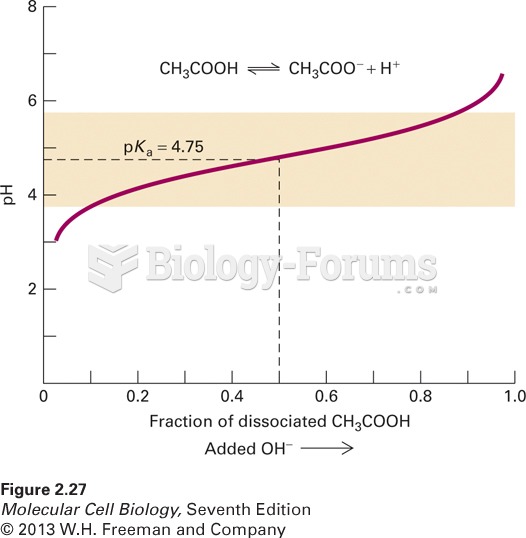 The titration curve of the buffer acetic acid (CH3COOH)
 Despite the globe’s vast social change, people all over the world continue to make race a ...
 States that require licensing or certification. Graphic provided by Associated Bodywork & ...
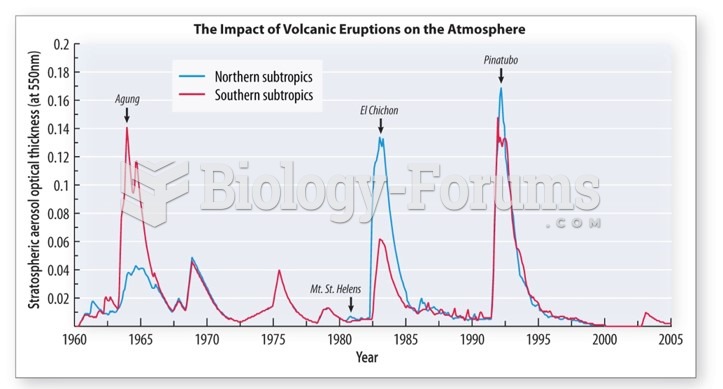 Mount Pinatubo caused ~1˚C cooling for up to 5 years