This topic contains a solution. Click here to go to the answer
|
|
|

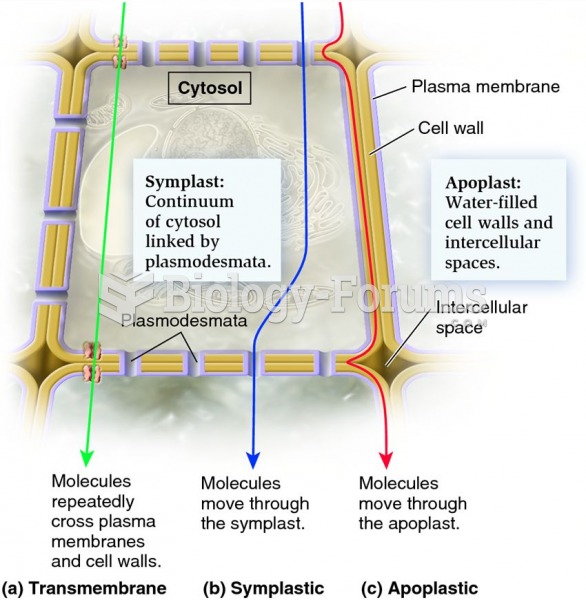 Three routes of tissue-level transport in plants: transmembrane, symplastic, and apoplastic.
 Responses to Viewing Form from Motion
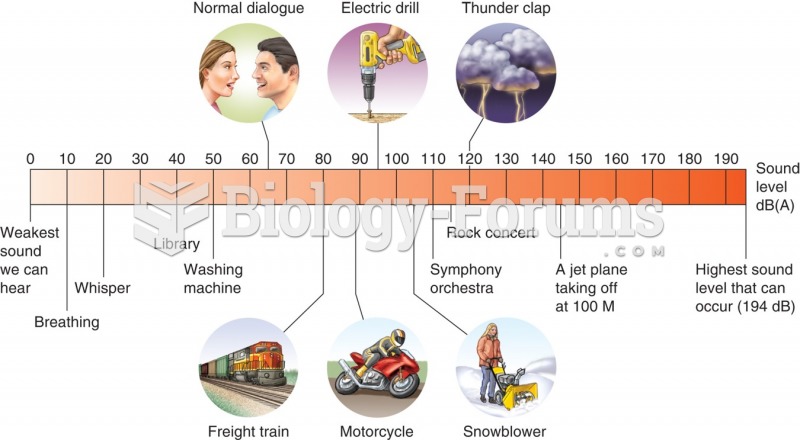 This illustration shows the decibel level in various locations and associated with different ...
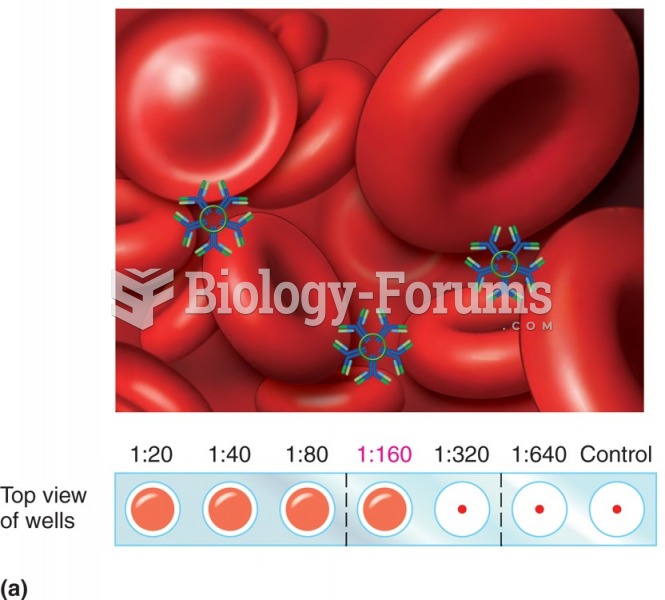 The bridging ability of IgM: (a) Pictorial view of IgM bridging of red cells. (b) Macroscopic view ...
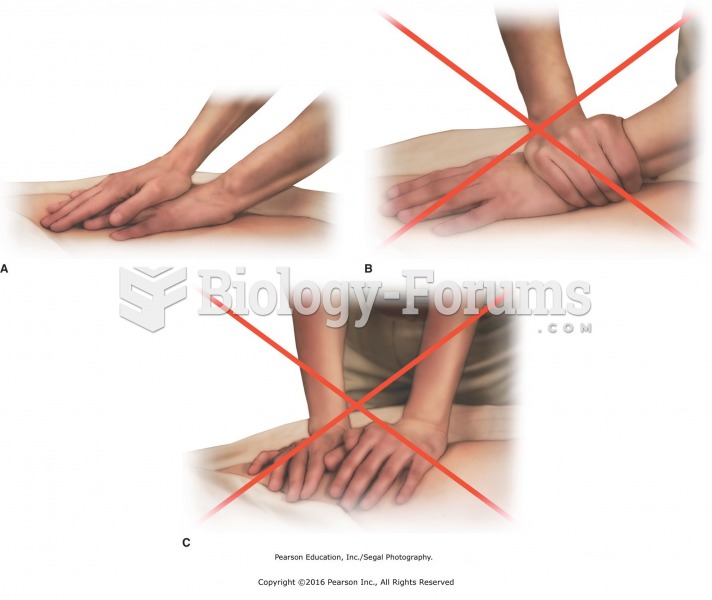 Correct wrist position while performing compression. A. Correct wrist position for compression ...
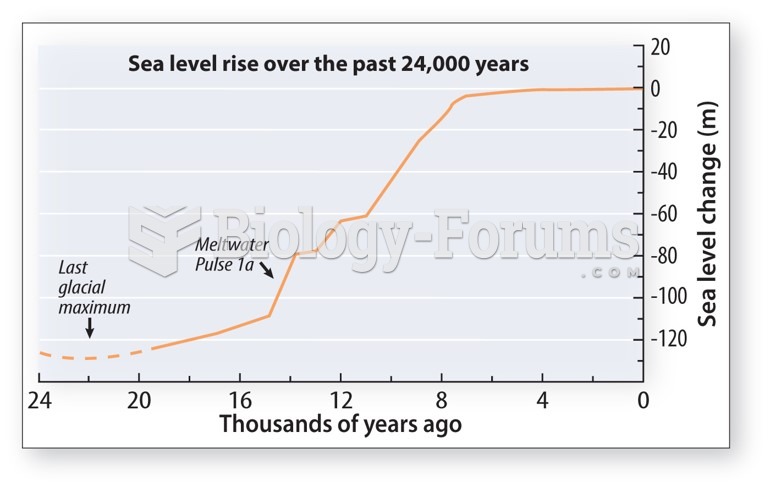 Rapid sea level rise