This topic contains a solution. Click here to go to the answer
|
|
|

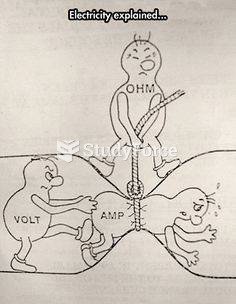 Electricity made easy
 Students in class
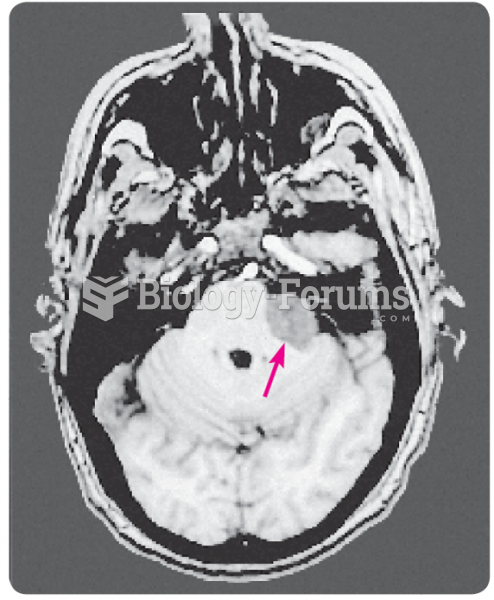 An MRI of Professor P.’s acoustic neuroma. The arrow indicates the tumor.
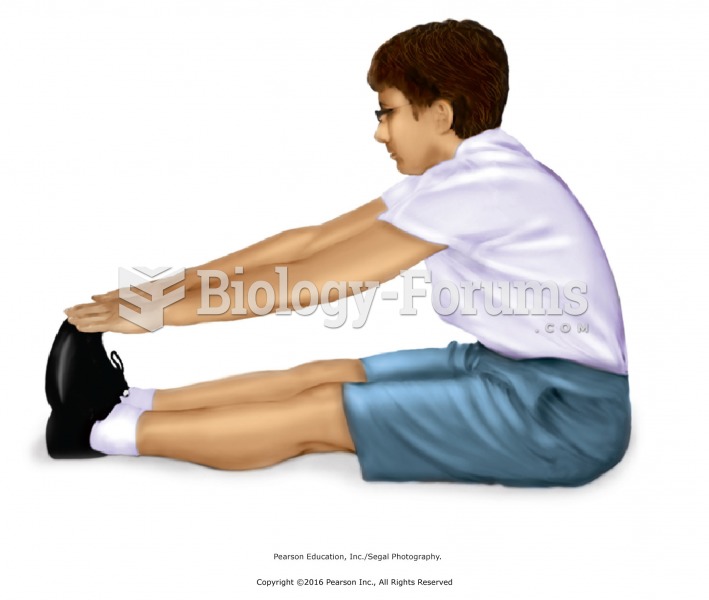 Sit-and-Reach Test for Overall Flexibility.
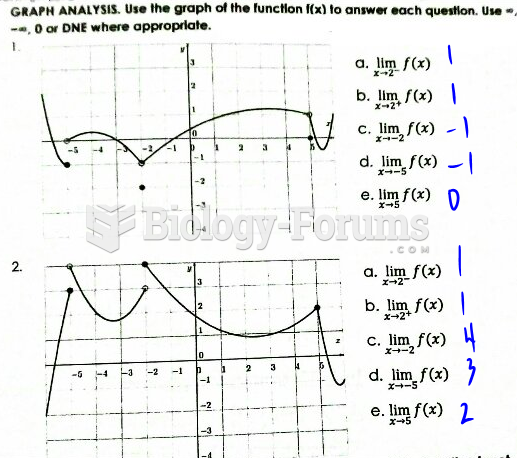 Use the graph of the function f(x) to answer each question.
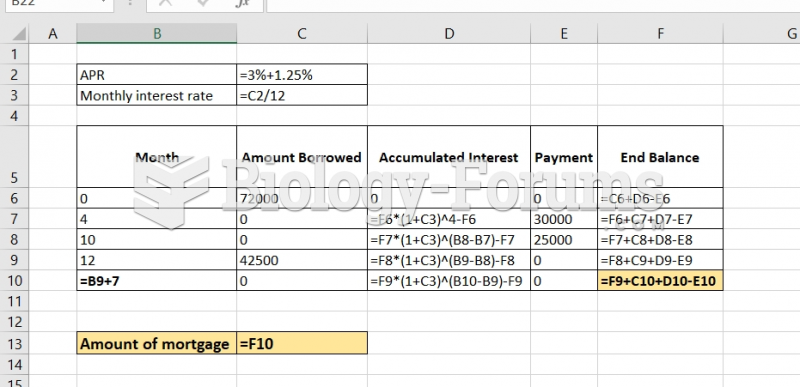 Raman has a line of credit loan with the ICICI bank. The initial loan balance was $72000.00. ...