This topic contains a solution. Click here to go to the answer
|
|
|

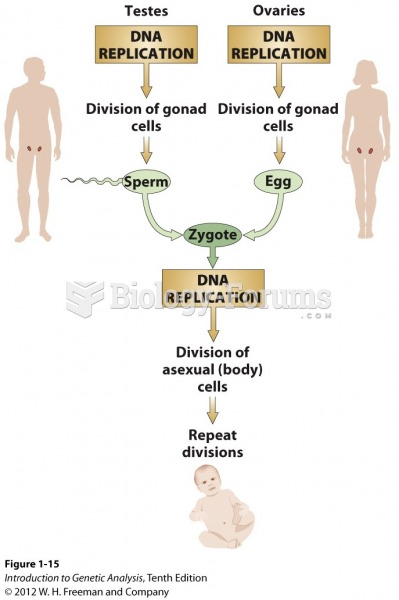 DNA replication is the basis for the perpetuation of life through time
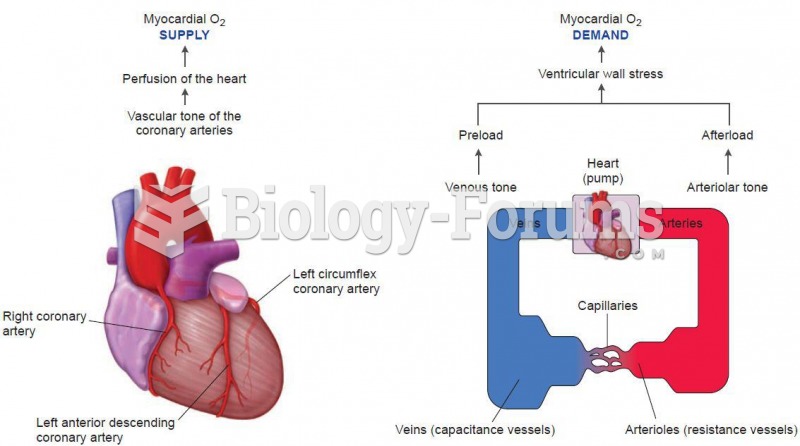 Myocardial Oxygen supply and demand
 Meal Time
 Shy children often have a high arousal level in novel social situations. Over time, parents can help ...
 Weak bones cause the spine to collapse over time
 Physics: Power, Energy and Time