This topic contains a solution. Click here to go to the answer
|
|
|

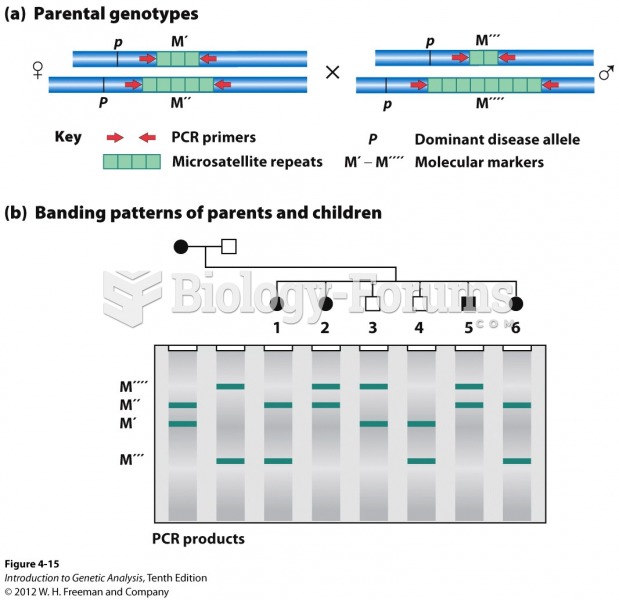 A microsatellite locus can show linkage to a disease gene
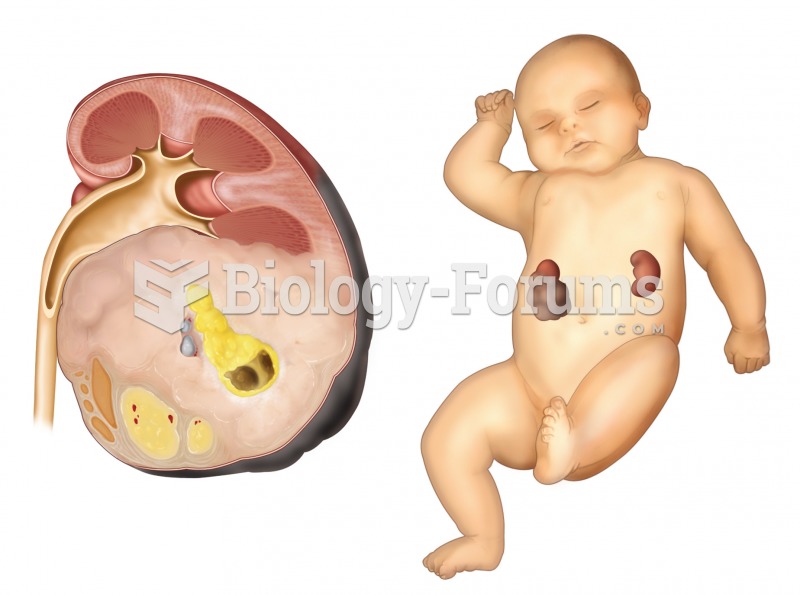 Nephroblastoma. A sectioned kidney reveals the presence of a very large tumor, which arose from feta
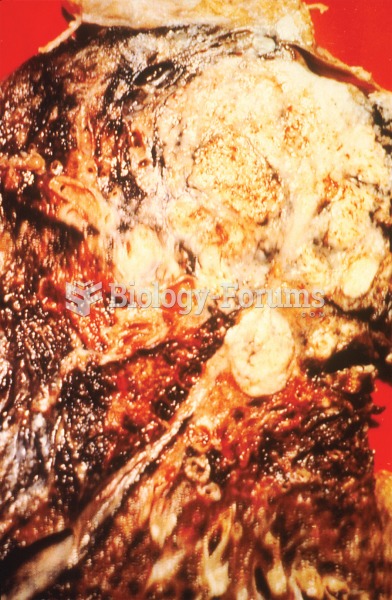 Lung cancer. Photograph of part of a lung removed after death. The yellow area is a large tumor and
 Children with insecure attachments may show angry behavior with peers, which can lead to peer ...
 Effleurage to the entire area with moderate pressure as a finishing technique. Apply effleurage ...
 Summer squash exhibiting various fruit-shape phenotypes, including disc, long, and sphere