Answer to Question 1
1. Here is the summary output for the monthly regression of the natural log of Cumulative Average Direct Labor-Hours per Unit on the natural logarithm of Cumulative Output:
SUMMARY OUTPUT
Regression Statistics
Multiple R 0.9989528
R Square 0.9979068
Adjusted R Square 0.9976975
Standard Error 0.0074326
Observations 12
ANOVA
df SS MS F Significance F
Regression 1 0.263368 0.263368 4767.34 9.89803E-15
Residual 10 0.000552 5.52E-05
Total 11 0.26392
Coefficients Standard Error t Stat P-value Lower 95 Upper 95
Intercept 2.09 0.02 85.44 0.00 2.03 2.14
X Variable 1 0.21 0.00 69.05 0.00 0.21 0.20
2. The plot of the data and the regression line estimated above are provided next.
Economic
plausibility A negative relationship between cumulative average direct-labor hours per unit and cumulative output (in natural logarithms) is economically plausible and reflects the presence of learning effects. Specifically, as the firm gains experience from production, it becomes more efficient and is able to use fewer direct labor hours to make each unit of product.
Goodness of fit r2 = 99.8, Adjusted r2 = 99.8
Standard error of regression = 0.007
Unparalleled goodness of fit. Virtually perfect linear fit in logarithms.
Significance of independent
variables The t-value of 69.05 for the logarithm of cumulative output is significant at all conventional levels. The t-value for the intercept (85.44) is highly significant as well.
3. The original learning curve specification, y = axb is mathematically identical to the following log-linear specification:
Ln y = Ln a + b Ln x
The regression equation we have estimated,
Ln (Cumulative avg DLH per unit) = a + (b Ln (Cumulative Output))
is precisely the above specification, and in particular, the slope coefficient directly yields the b from the learning curve equation. We know, therefore, that for Hankuk electronics, b = 0.208. As explained in Exhibit 10- 10, this value is related to the learning curve percentage as follows:
b = Ln(learning-curve in decimal form)/Ln 2, or
0.208 = Ln(learning-curve in decimal form)/0.693, or
Ln(learning-curve in decimal form) = 0.208 0.693 = 0.144.
As the exponent of 0.144 is 0.8659, this implies that Hankuk is experiencing an 86.6 percent cumulative average-time learning curve.
4. With an additional 650 units in January 2014, Hankuk's cumulative output will go from 7,527 at the end of December 2013 to 8,177 (7,527 + 650). As Ln (8,177) = 9.0091, the cumulative average direct-labor hours in logarithmic terms are given by:
2.0876 0.2079 9.0091 = 0.2146.
The cumulative direct-labor hours per unit therefore equals Exp(0.2146) = 1.2394. This implies a total direct labor hours of 1.2394 8,177 = 10,134 by the end of January. As Hankuk has used a total of 9,480 direct labor hours at the end of December 2013, the incremental hours needed in January therefore are 654 (10,134 9,480). At 17.50 per labor hour, this suggest that Inbee should budget
654 17.50 = 11,445
for direct labor costs for January 2014.
Although 9.0091 is outside the range of cumulative output values (measured in logarithms) used to find the regression equation, unless there has been a structural break in the experience curve Hankuk is facing, it is highly likely that its January costs will be in the neighborhood of 11,445. The reason is that the estimated regression line is close to perfect and has a standard error close to zero. There is virtually no uncertainty around the coefficient estimates. The slope coefficient, for example, has a point estimate of 0.2079, and a narrow 95 percent confidence interval between 0.2146 and 0.2012. Using either of those estimates would make barely any difference to the predicted cost for the month of January 2014.
Answer to Question 2
D

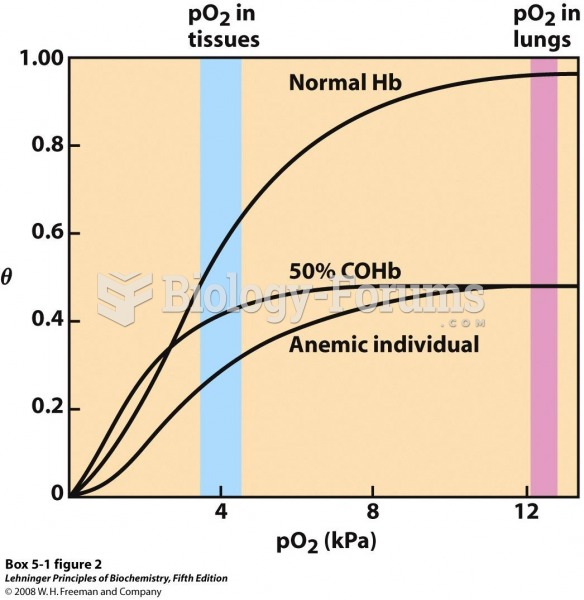 2 Several oxygen-binding curves: for normal hemoglobin
 Vertebral regions showing the four spinal curves.
 Cost Accounting 14
 Nursing: A Concept-Based Approach to Learning, Volume II, 3rd Edition
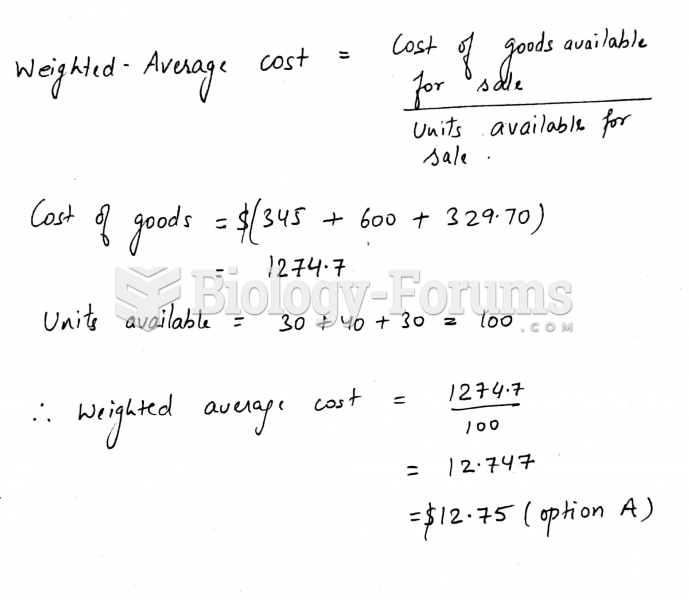 Calculate the weighted-average cost of the following inventory purchases:DateQuantity ...
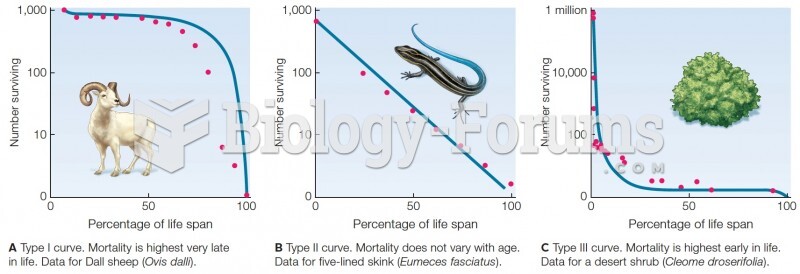 Survivorship curves. Blue lines are theoretical curves. Red dots are data from field studies.