Matching graphs with descriptions of cost and revenue behavior.
(D. Green, adapted) Given here are a number of graphs.
The horizontal axis of each graph represents the units produced over the year, and the vertical axis represents total cost or revenues.
Required:
Indicate by number which graph best fits the situation or item described (ah). Some graphs may be used more than once; some may not apply to any of the situations.
a. Direct material costs
b. Supervisors' salaries for one shift and two shifts
c. A cost-volume-profit graph
d. Mixed costsfor example, car rental fixed charge plus a rate per mile driven
e. Depreciation of plant, computed on a straight-line basis
f. Data supporting the use of a variable-cost rate, such as manufacturing labor cost of 14 per unit produced
g. Incentive bonus plan that pays managers 0.10 for every unit produced above some level of production
h. Interest expense on 2 million borrowed at a fixed rate of interest
Question 2
What is the effect of the following error? A check was written for 450 to pay the advertising bill received and recorded earlier in the month. The accountant debited Advertising Expense for 450 and credited Cash for 450.
a. Net Income was understated.
b. Cash was understated.
c. Accounts Receivable was understated.
d. Accounts Payable was overstated.
e. Choices a. and d. are both correct.

 Green bee eater,nagpur,India
 Explaining Behavior
 Children with insecure attachments may show angry behavior with peers, which can lead to peer ...
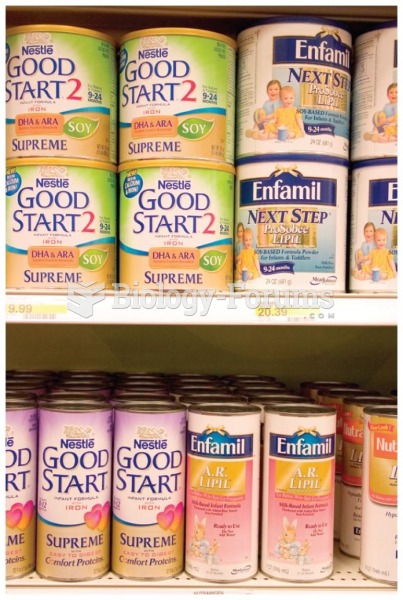 Infant formula is available in several forms and varies in cost and ingredients
 Molecular Genetics DNA picture matching question
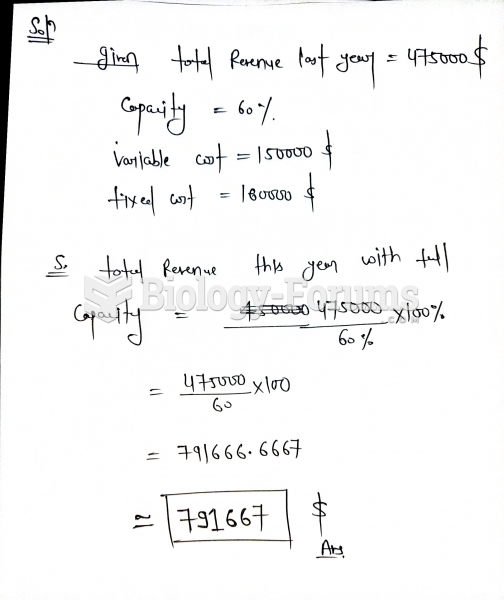 Last year, Terrific Copying had total revenue of $475 000, while operating at 60% of capacity. ...