This topic contains a solution. Click here to go to the answer
|
|
|

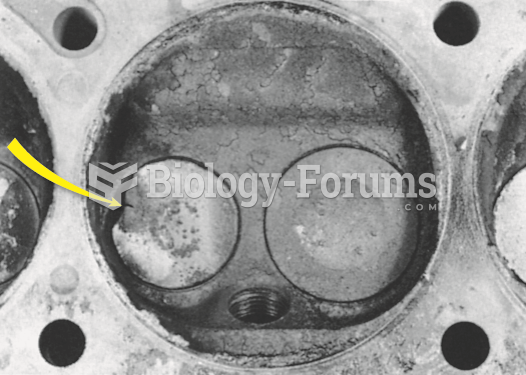 Badly burned exhaust valve. A compression test could have detected a problem, and a cylinder ...
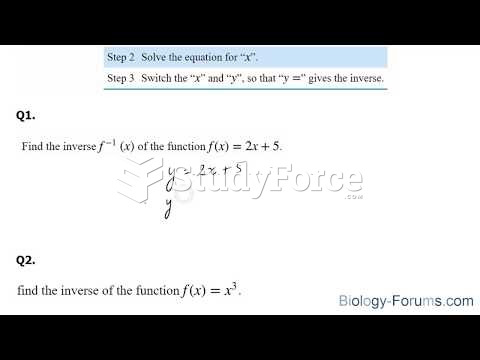 How to find the inverse of any function
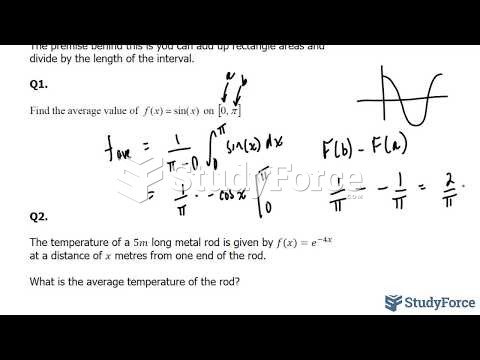 How to find the average value of a function
 Infant and Toddler Development and Responsive Program Planning: A Relationship-Based Approach
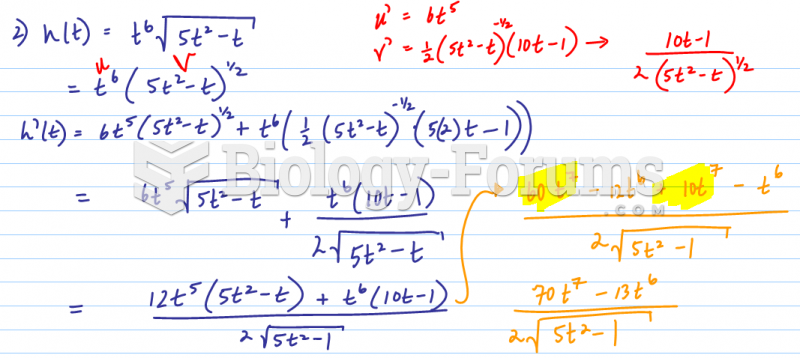 To find derivative us the chain rule
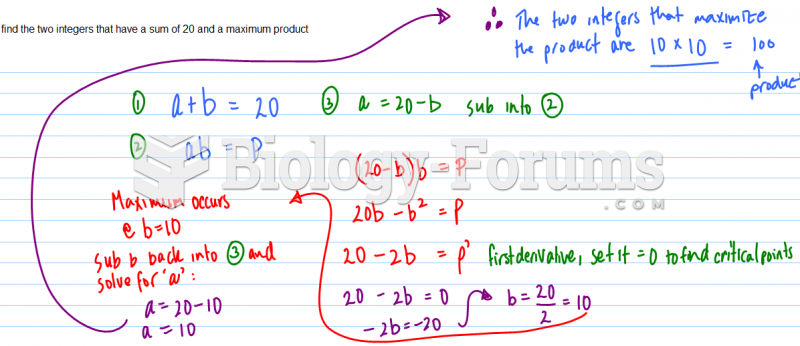 Find the two integers that have a sum of 20 and a maximum product