This topic contains a solution. Click here to go to the answer
|
|
|

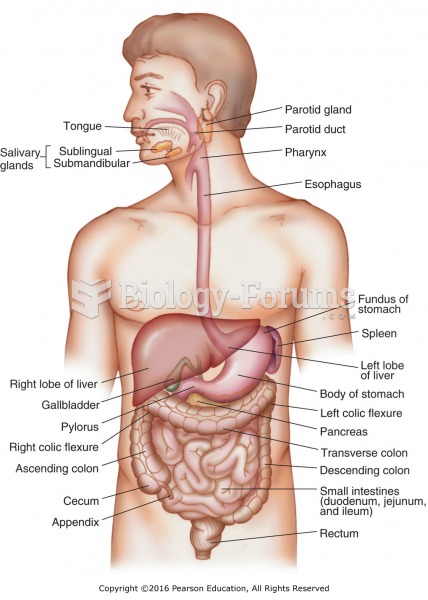 The digestive system.
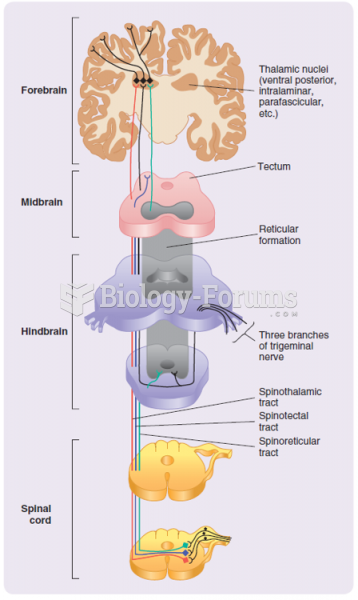 The anterolateral system. The pathways from only one side of the body are shown.
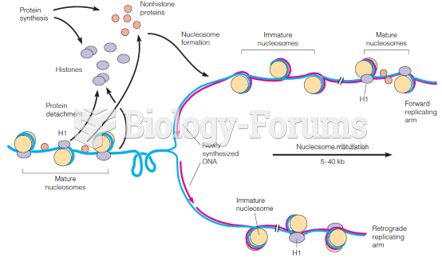 Model for chromatin replication
 How to use a tree diagram to find the probability
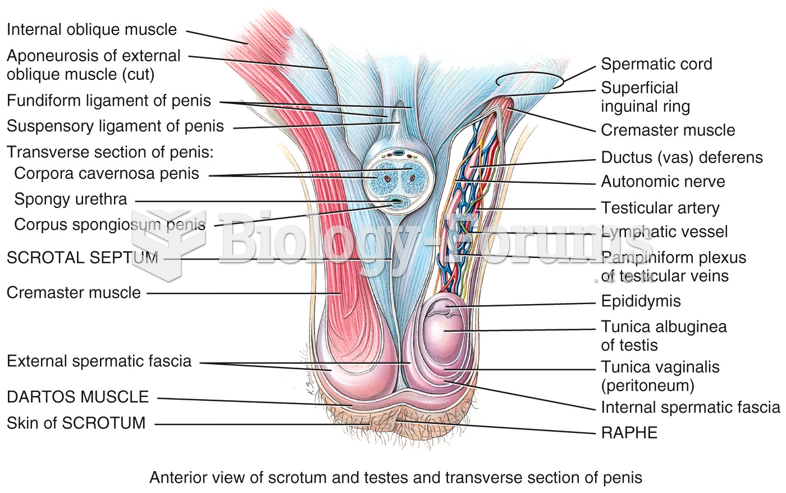 Male Reproductive System - Scrotum
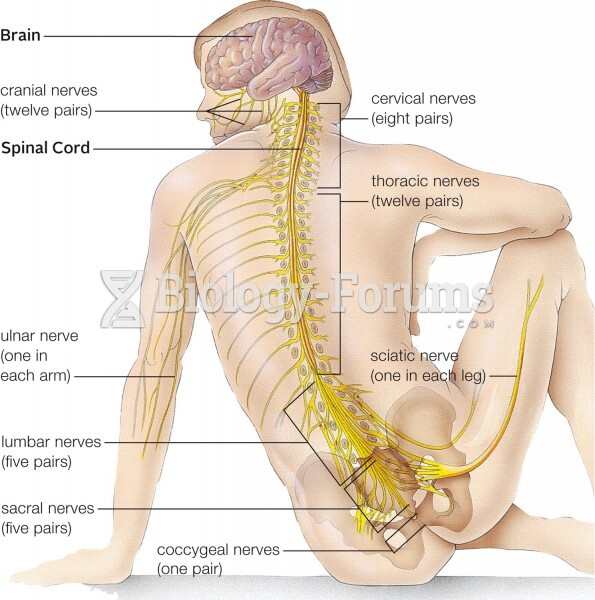 Some of the major nerves of the human nervous system