This topic contains a solution. Click here to go to the answer
|
|
|

 Nursing School Humor
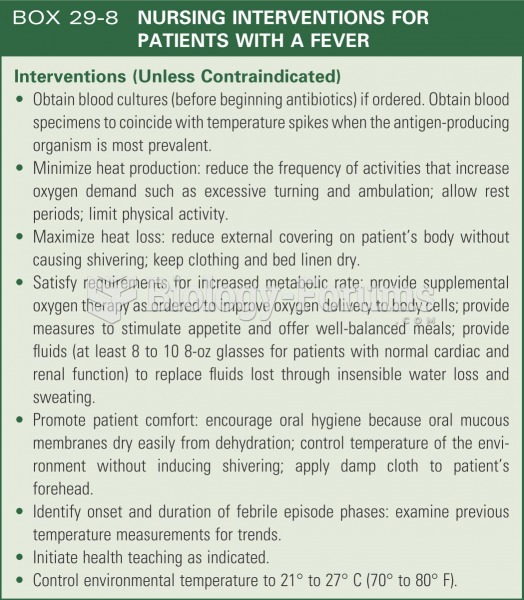 Nursing interventions for patients with a fever
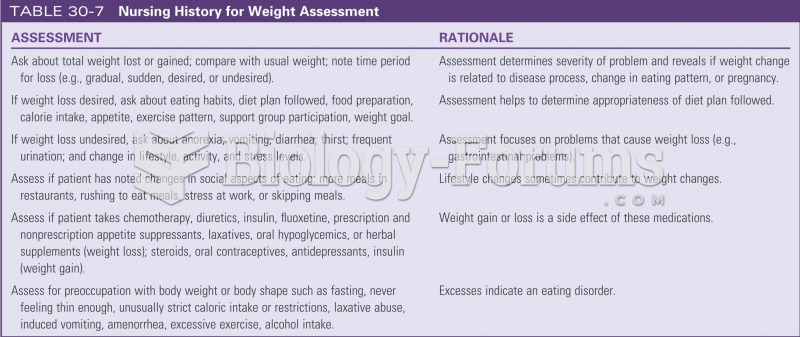 Nursing history for weight assessment
 Nursing
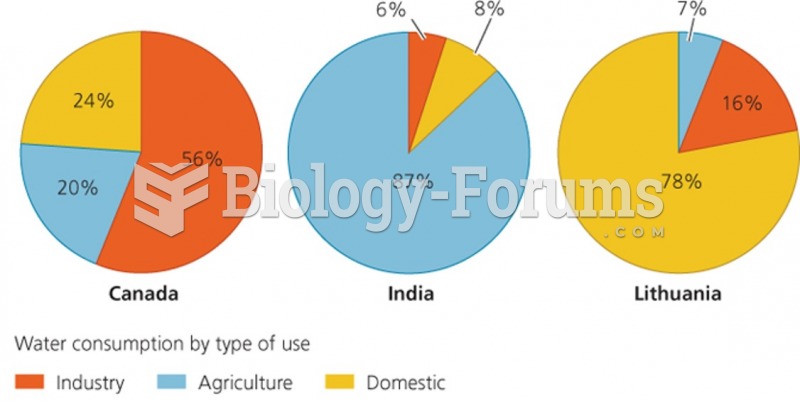 Water consumption by type of use
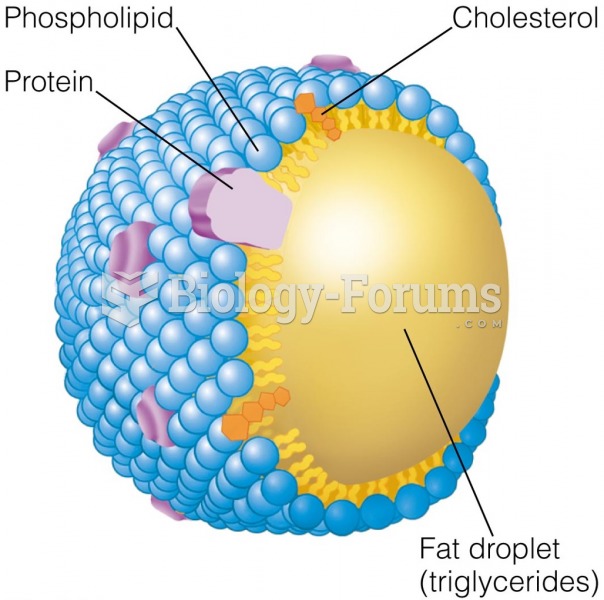 Chylomicron Chylomicrons are one type of lipoprotein