This topic contains a solution. Click here to go to the answer
|
|
|

 Connell's experimental manipulation of species indicated the presence of competition.
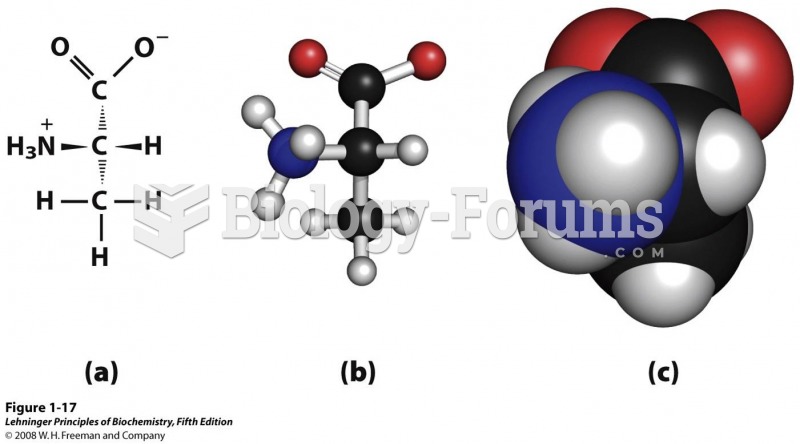 Representations of molecules
 A Subtitle C Landfill Design
 Starting Out with Programming Logic and Design
 Importance of Considering Gestalt Principles in Product Design
 A graphic depiction of predisposing alleles characteristic of a threshold trait within a population,