Answer to Question 1
ANS: A, C
A relational statement declares that a relationship of some kind exists between or among two or more concepts. Relational statements describe the direction, shape, strength, symmetry, sequencing, probability of occurrence, necessity, and sufficiency of a relationship. The strength of a relationship is the amount of variation explained by the relationship. In a linear relationship, the relationship between the two concepts remains consistent regardless of the values of each of the concepts. For example, if the value of A increases by 1 point each time the value of B increases by 1 point, the values continue to increase at the same rate whether the value is 2 or 200. The relationship can be illustrated by a straight line, as shown in the figure. In a curvilinear relationship, the relationship between the two concepts varies according to the relative values of the concepts. A negative relationship implies that as one concept changes, the other concept changes in the opposite direction.
Answer to Question 2
ANS: A, B, F
A relational statement declares that a relationship of some kind exists between or among two or more concepts. Relational statements describe the direction, shape, strength, symmetry, sequencing, probability of occurrence, necessity, and sufficiency of a relationship. The strength of a relationship is the amount of variation explained by the relationship. In regard to shape, most relationships are assumed to be linear. In a linear relationship, the relationship between the two concepts remains consistent regardless of the values of each of the concepts. The relationship can be illustrated by a straight line. Relationships can be curvilinear or some other shape. In a curvilinear relationship, the relationship between the two concepts varies according to the relative values of the concepts. This type of relationship is illustrated by a curved line, as shown in the figure.

 The linear meiosis of Neurospora
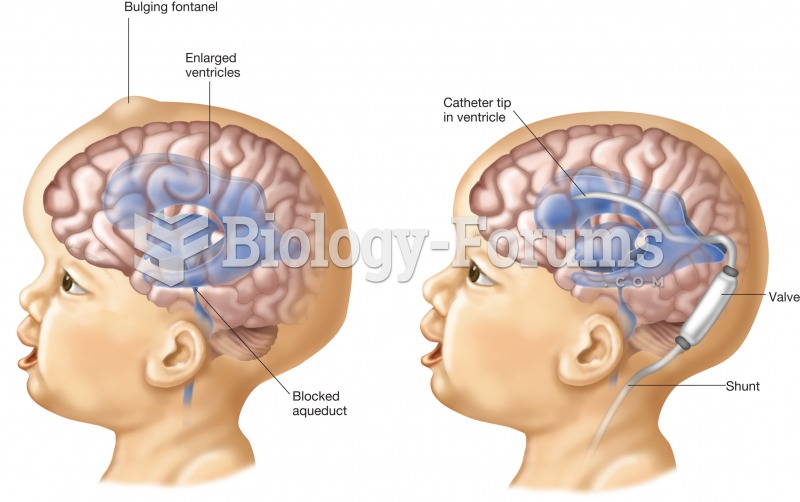 Hydrocephalus. The figure on the left is a child with the enlarged ventricles of hydrocephalus. The
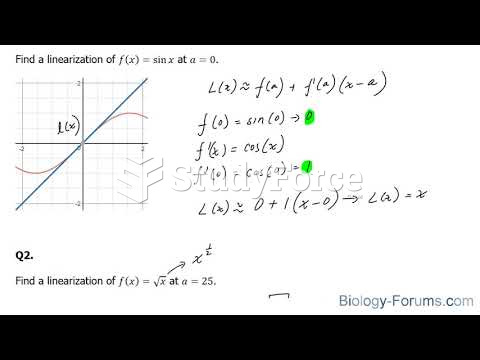 How to perform linear approximations in calculus
 How to determine the x- and y- intercepts of a linear equation
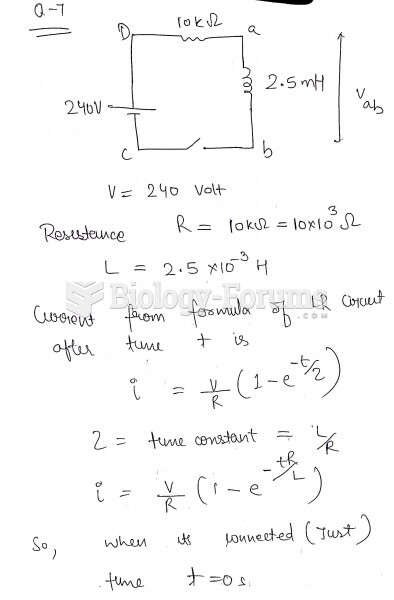 The figure shows an LR circuit with a switch and a 240-volt battery. At the instant the switch ...
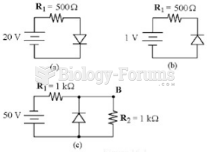 What is the current in Figure 16-1(b) if the diode is made of silicon and the polarity of the ...