This topic contains a solution. Click here to go to the answer
|
|
|

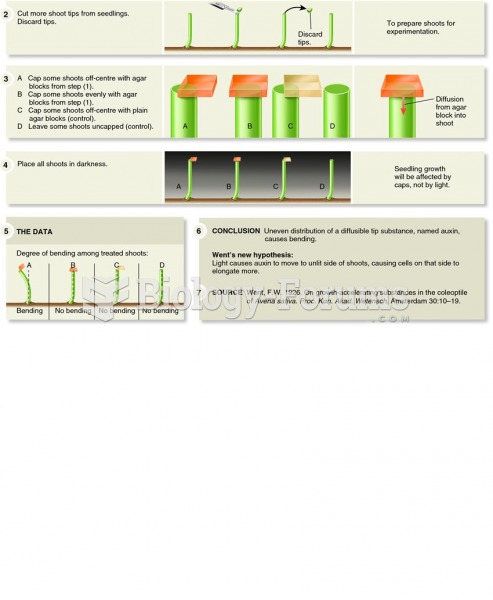 Went and Briggs demonstrated the relationship between light perception and auxin function.
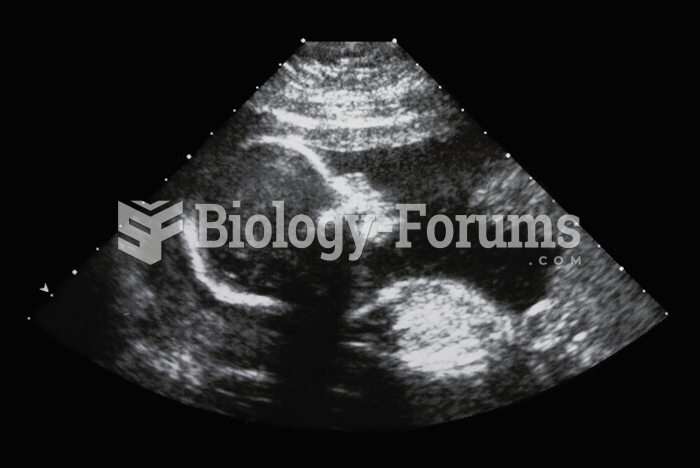 The photo shows an ultrasound image of a fetus of about 20 weeks’ gestational age.
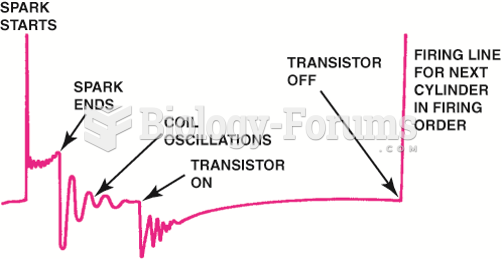 Drawing shows what is occurring electrically at each part of the scope pattern.
 Increased neurogenesis in the dentate gyrus following damage. The left panel shows (1) an ...
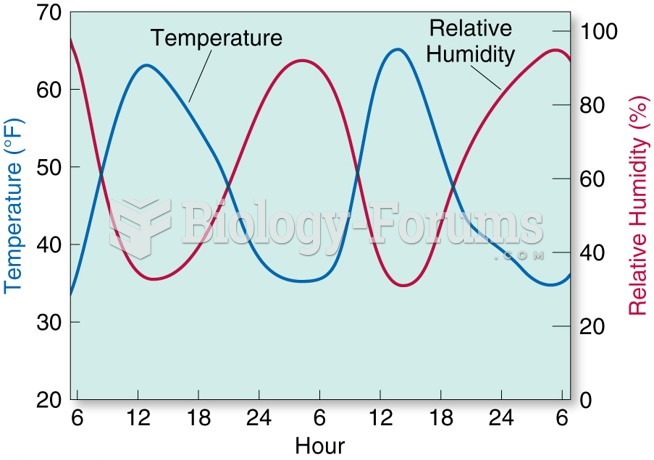 The relationship between RH and temperature.
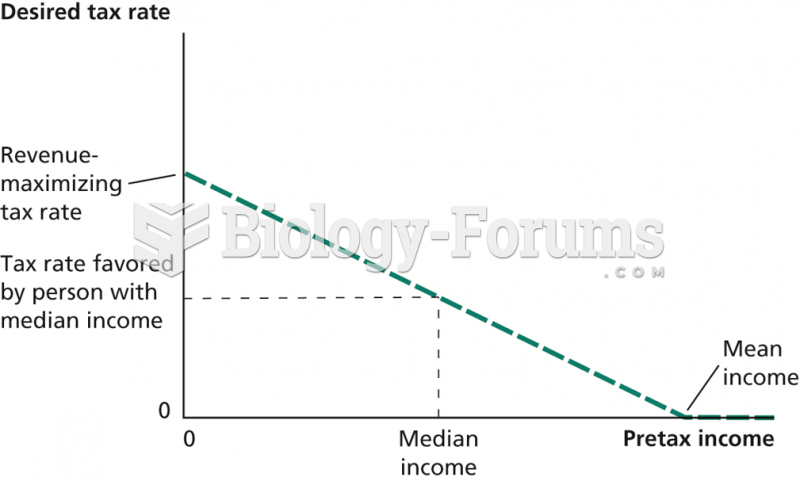 Relationship between Income Inequality and the Desired Tax Rate