This topic contains a solution. Click here to go to the answer
|
|
|

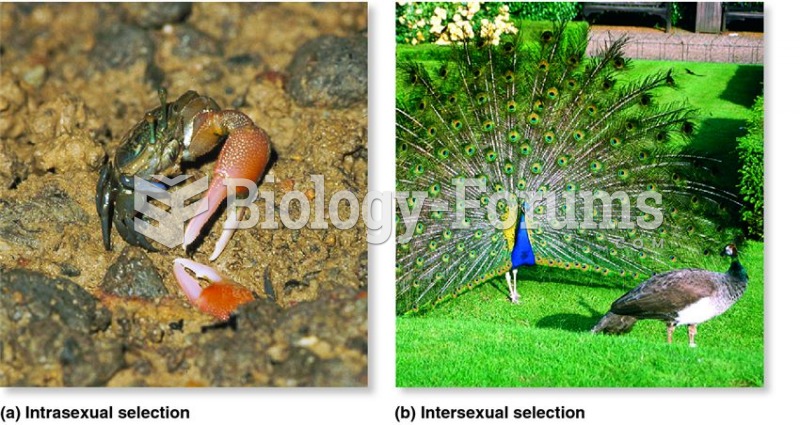 Examples of the results of sexual selection, a type of natural selection.
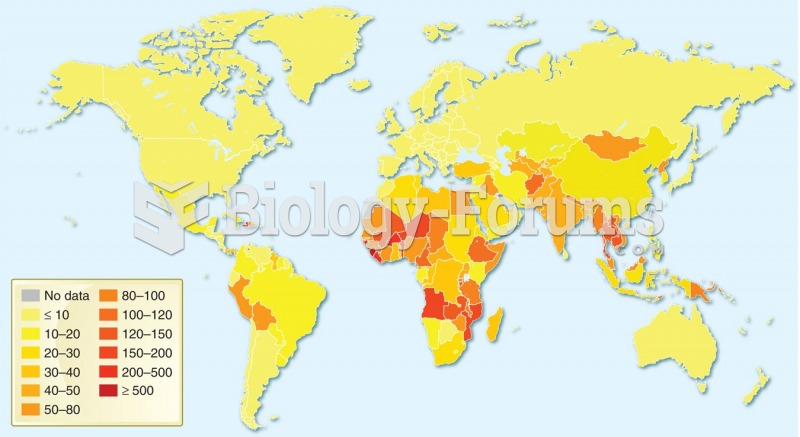 Age-standardized disability-adjusted life year (DALY) rates from hepatitis B by country (per 100 000 ...
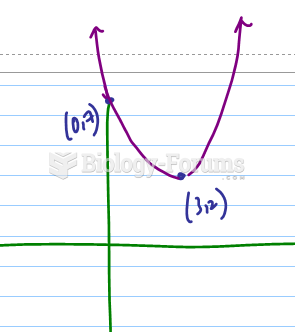
 How to graph quadratic equations that are in vertex form
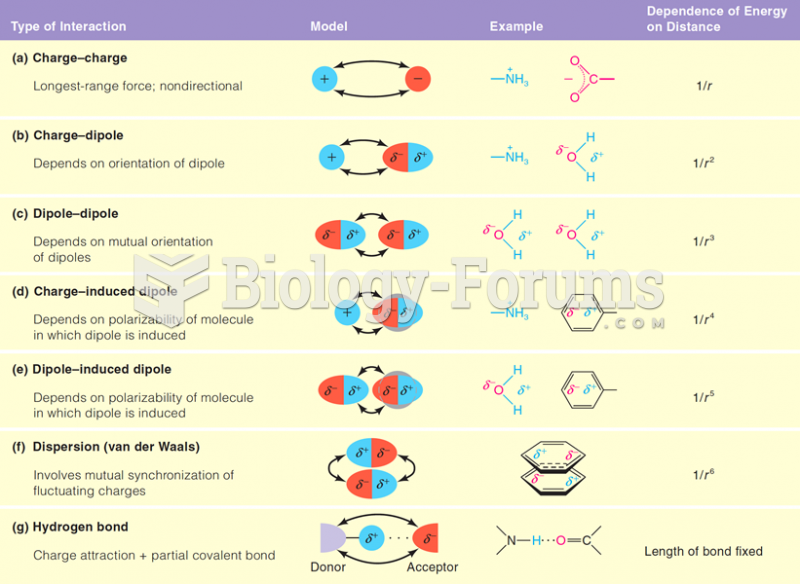 Type of Interactions, Model, Examples and Dependence of Energy on Distance
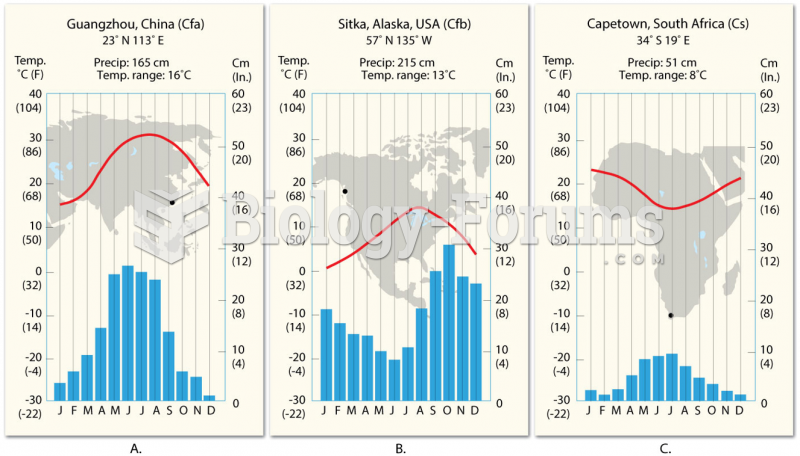 Comparison of C-type Climates
 If a graph has the following x-intercepts, which value of x is the instantaneous rate of change ...