This topic contains a solution. Click here to go to the answer
|
|
|

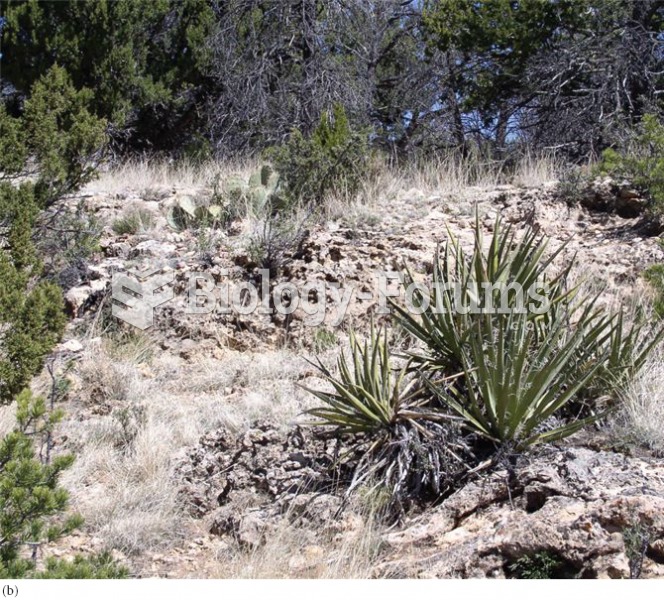
 Areas of differing productivity and diversity in a wetland. (a) Typha dominates core habitats, while
 Areas of differing productivity and diversity in a wetland. (a) Typha dominates core habitats, while
 3 Areas of damage after a myocardial infarction
 The Reticular Activating System and Related Regions in the Brain Are Important Areas of Focus for D
 In 2013, Americans learned that the federal government massively surveys their phone calls and e-mai
 Get feedback every 5 to 7 minutes about cold intensity. Massage other areas while cold source is on ...