matching
a. Unorganized data.
b. Have the same reference point and the same standard deviation.
c. The difference between the highest and the lowest scores in a distribution.
d. Sum of a set of scores divided by the number of scores.
e. A bell-shaped curve in which the mean, median and mode are all the same value, is symmetrical about its midpoint and is asymptotic.
f. Likelihood
g. Describe the general characteristics of a set of scores or data.
h. Two or more data points.
i. A measure of central tendency that can be used when the data is nominal.
j. Degree of spread or dispersion that characterizes a group of scores and the degree to which a set of scores differs from some measure of central tendency.
k. Transferring data from the original collection form into a format the lends itself to data analysis.
l. An average or individual value that is most representative of that distribution or set of scores.
m. A form used to organize for analysis the data you collect.
n. A machine that reads and records responses on special scoring sheets, comparing responses to a key.
o. A type of standard score the result of dividing the amount that an idividual score deviates from the mean by the standard deviation.
p. The average amount that each of the individual scores varies from the mean of the set of scores.
q. A measure of central tendency used when the data is ordinal or when extreme scores are included in the sample.
r. A straight line associated with a curve such that as a point moves along an infinite branch of the curve the distance from the point to the line approaches zero (definition from Websters.com).
1. Raw data
2. Data collection form
3. Optical scanner
4. Coding data
5. Descriptive statistics
6. Distribution of scores
7. Measure of central tendency
8. Mean
9. Median
10. Mode
11. Variability
12. Range
13. Standard deviation
14. Normal Curve
15. Asymptotic
16. Standard scores
17. zscore
18. Probability
Question 2
According to the text, the exposure of participants to all three monitor sizes represents a matched subjects design.
Indicate whether the statement is true or false

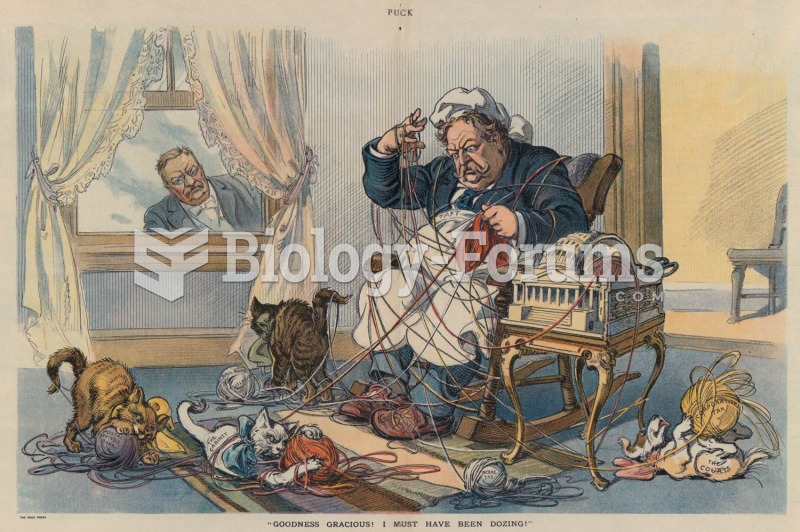 A hapless Taft is entangled in governmental yarn, while a disapproving Roosevelt looks on. “Goodness
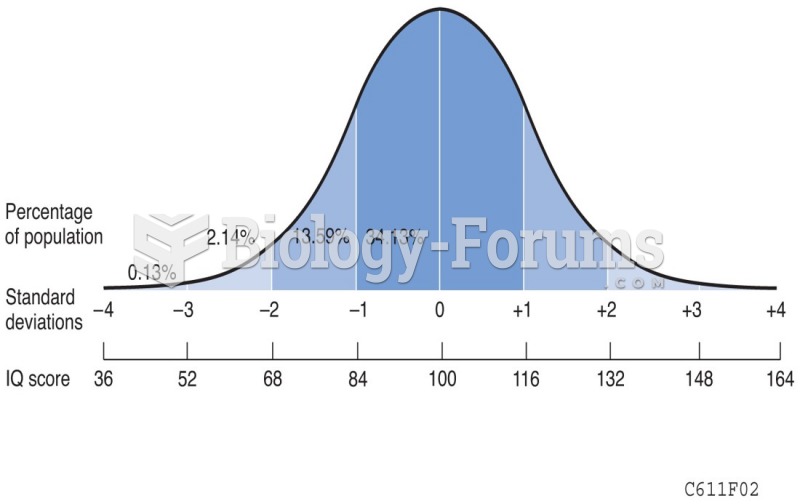 Calculating the Deviation IQ Score
 Direct thumb pressure to a trigger point.
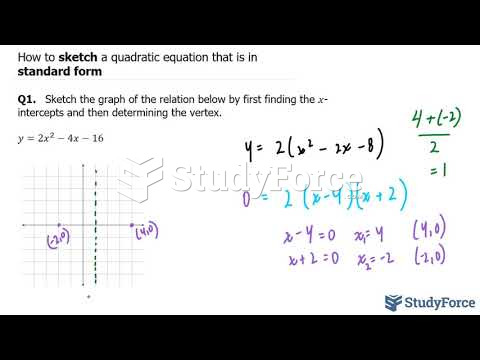 How to sketch a quadratic equation that is in standard form (Question 1)
 Two-point discrimination
 The molality of a C12H23O11 solution is 0.6 m. what is the freezing point of the solution C?