This topic contains a solution. Click here to go to the answer
|
|
|

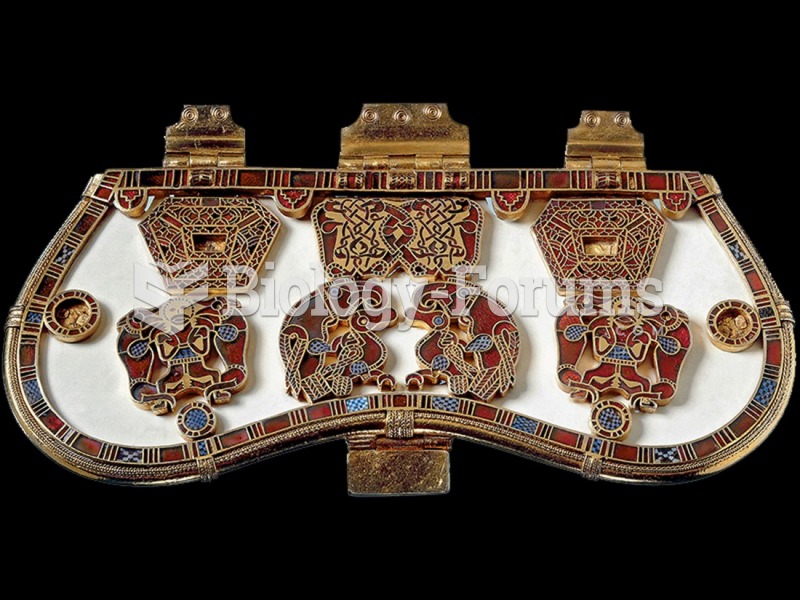 Purse cover, from the Sutton Hoo burial ship.
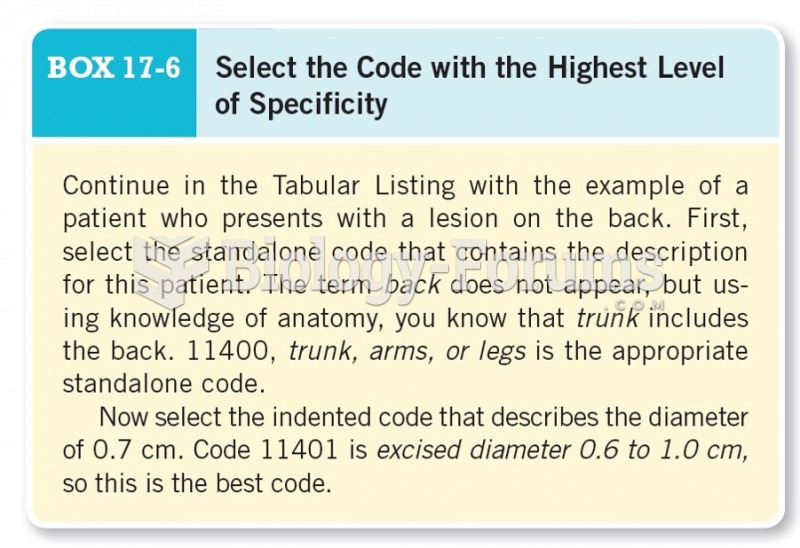 Select the Code with the Highest Level of Specificity
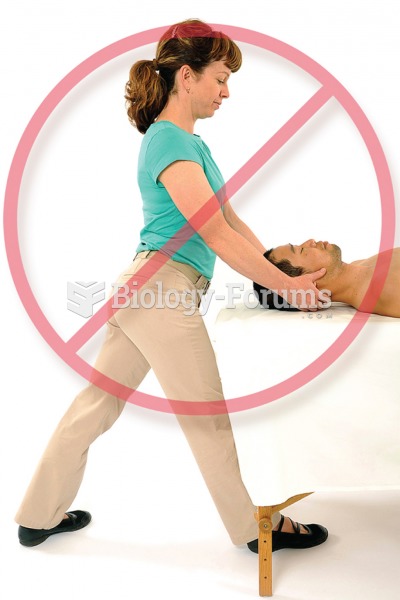 Stand in a doorway and hook your fingertips on both sides about chest level or lower.
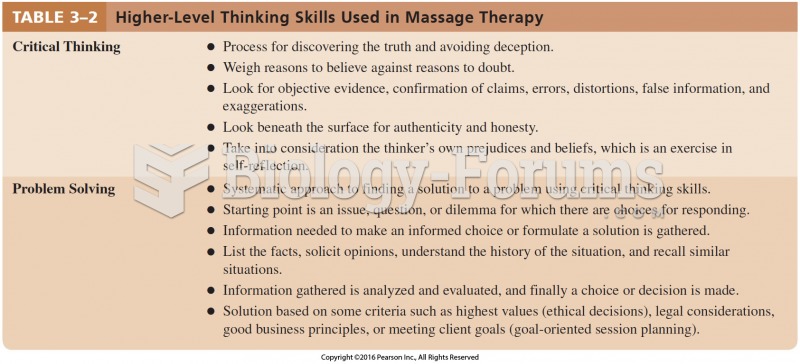 Higher-Level Thinking Skills Used in Massage Therapy
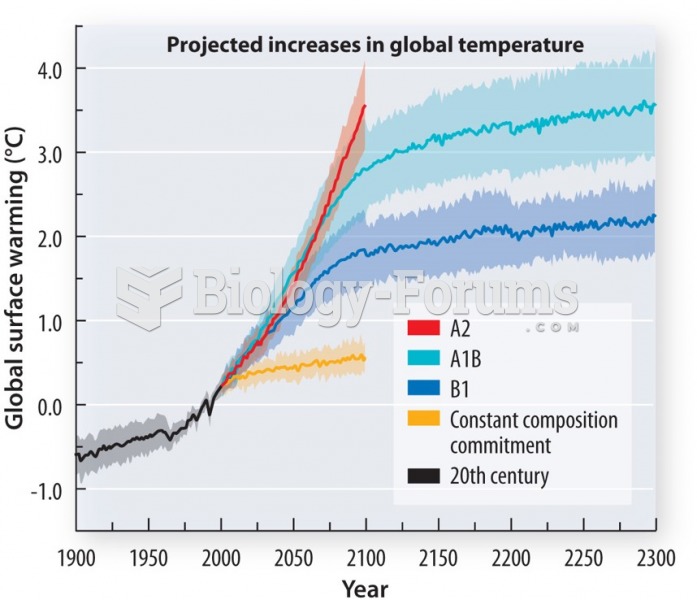 Projections of global temperature depend heavily on the level of future greenhouse gas emissions
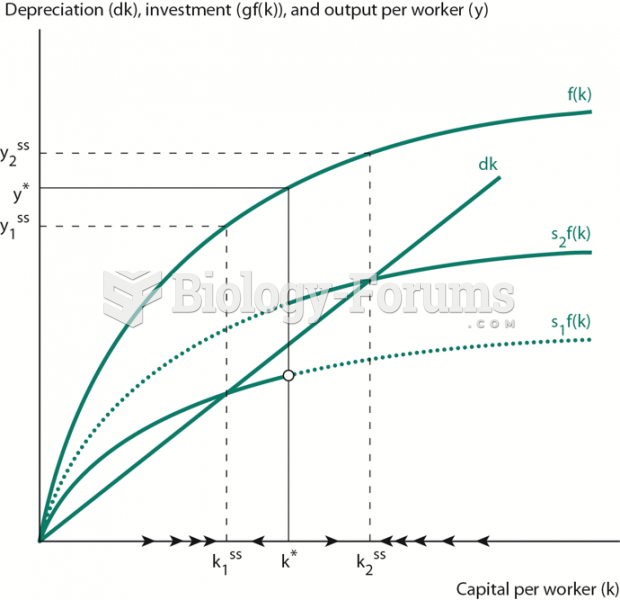 Solow Model with Saving Dependent on Income Level