This topic contains a solution. Click here to go to the answer
|
|
|

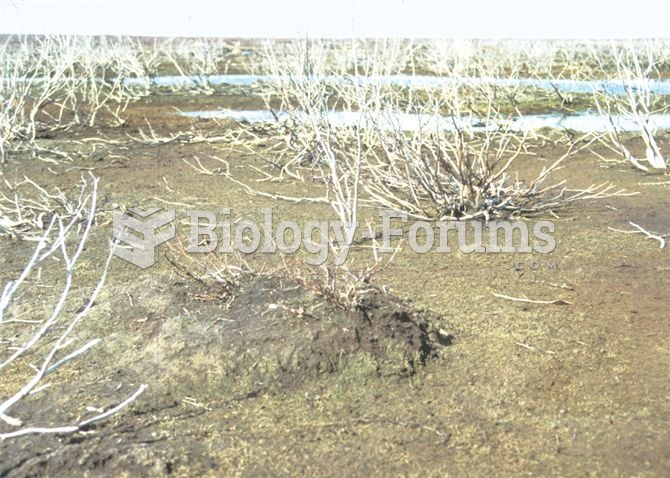 Rapid population growth of geese has resulted in extensive areas of La Perouse Bay becoming d
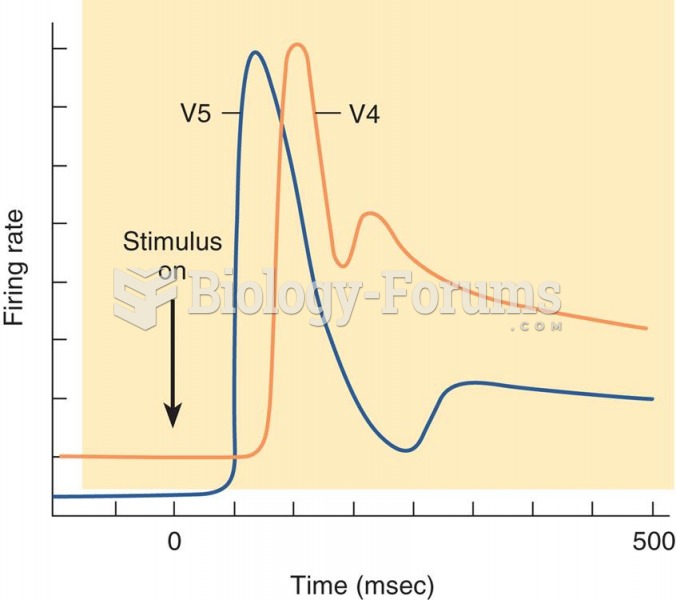 Responses of Neurons in Areas V4 and V5
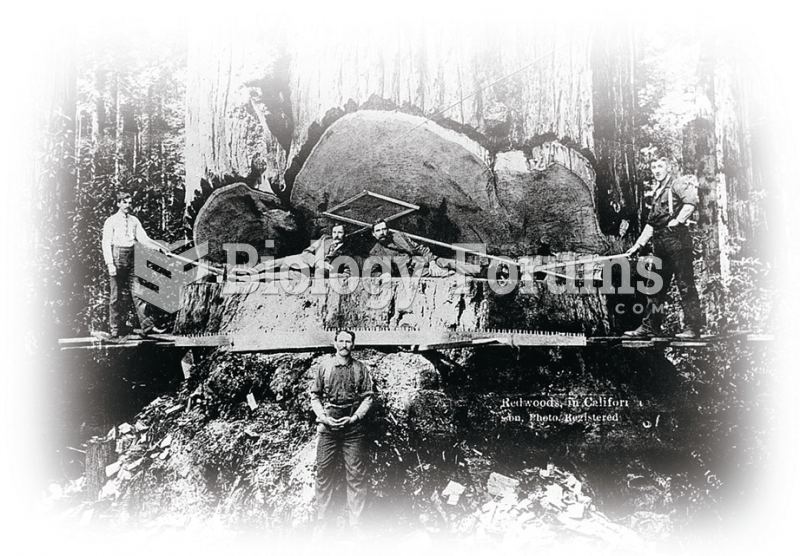 Values, both those held by individuals and those that represent a nation or people, can undergo deep ...
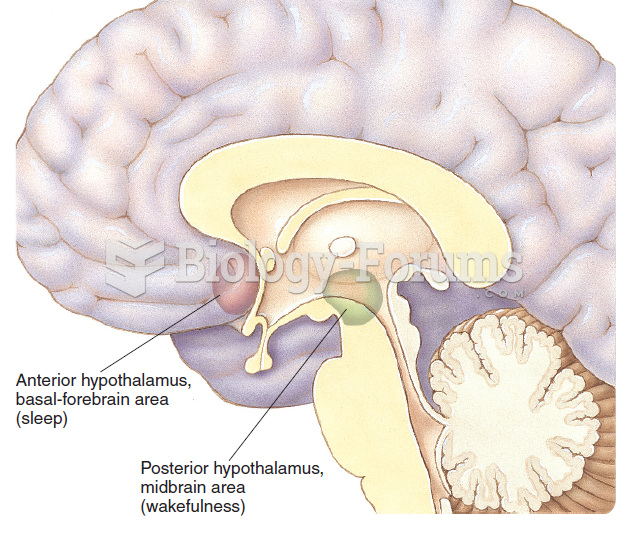 Two regions of the brain involved in sleep. The anterior hypothalamus and adjacent basal forebrain ...
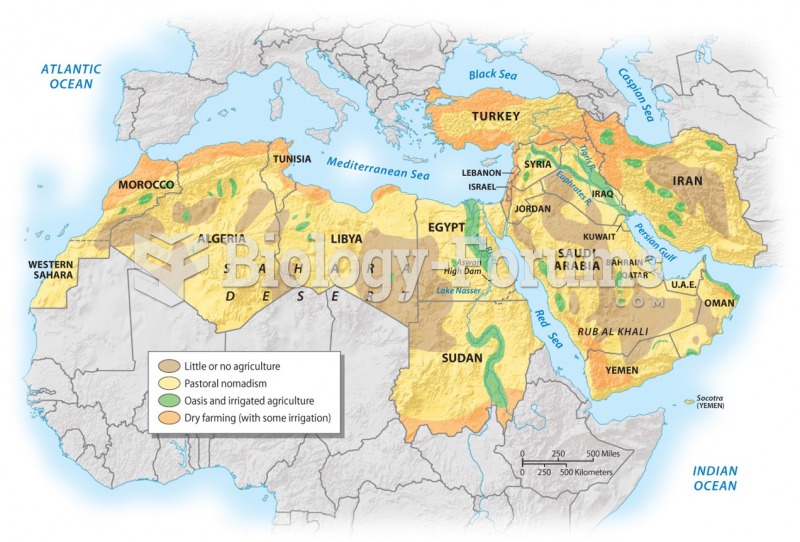 Agricultural Regions
 Human mtDNA molecule, showing the locations of HVS I and II regions relative to other mtDNA genes