|
|
|

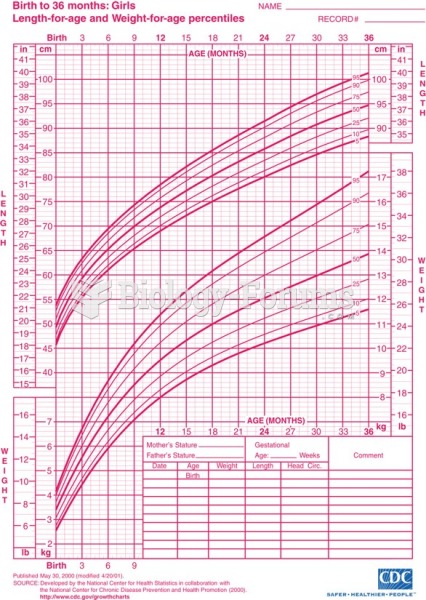 Calculating Growth Percentiles
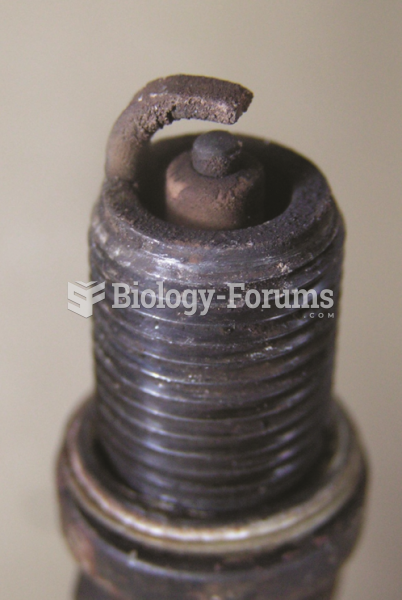 A worn spark plug showing fuel and/or oil deposits.
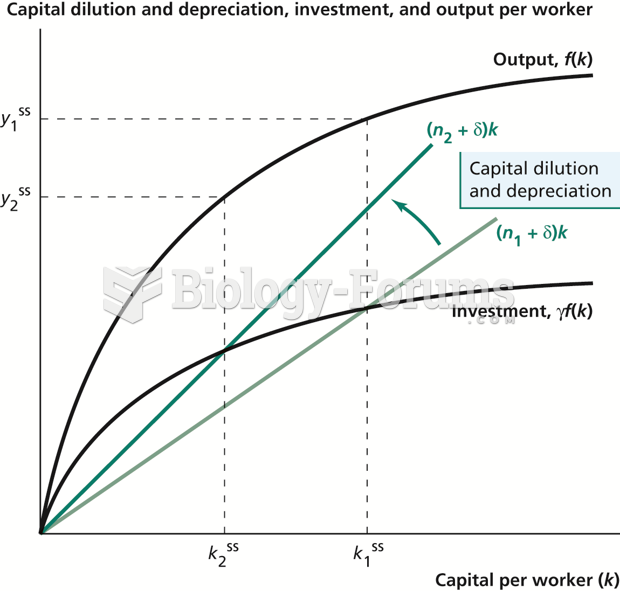 The Solow Model Incorporating Population Growth
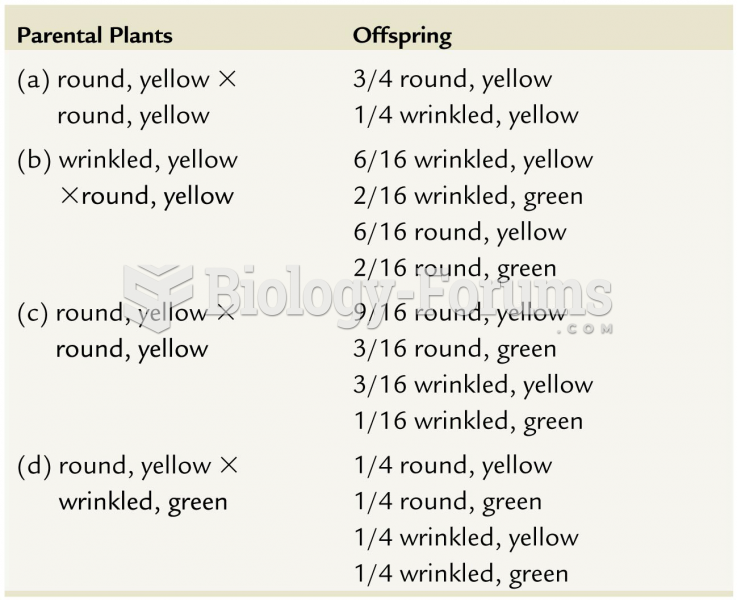 Table showing comparing between Parental Plants vs. Offspring
 Electropherogram showing the STR profiles of four samples from a rape case
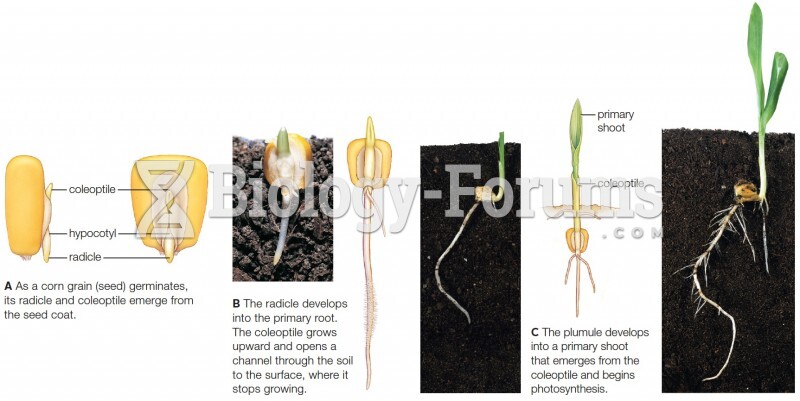 Early growth of corn (Zea mays), a typical monocot.